Pharmacophore an International Research Journal
KNOWLEDGE AND ATTITUDE OF ARAB ADULT FEMALES TOWARDS THE ELDERLY IN THE EASTERN PROVINCE OF SAUDI ARABIA
Randa Hamadeh1, Aljohara Al-Enzi2*, Dalia Murshid2, Fatimah Al-Hassan2, Hanady Al-Misrea2, Layan Al-Bassam2, Mawadah Al-Edrissy2, Sarah Al-Baridi2, Sara Al-Tamimi2
|
|
|
ABSTRACT
Background: Aging has become a phenomenon of population trends with improved health conditions and standards of living. Objective: Our objective was to identify the knowledge of Arab female adults on the common diseases and main health problems encountered by the elderly, determine their knowledge towards health services provided for the elderly, and to compare the female adult knowledge and attitude towards the elderly by socio-demographic characteristics. Method: A cross-sectional study using a self-administered questionnaire was distributed to the female adults between the ages of 18 to 64 who attended the selected malls. Conclusion: The study showed that 61.3% of the women had good overall knowledge about the elderly with statistically significant differences by educational level and working in a health profession. There was no statistical significance between the respondents’ age, occupation, and contact with the elderly and their attitude towards the elderly. On the other hand, it was statistically significant that their marital status, educational level, and employment affected their attitude towards the elderly.
Keywords: Knowledge & Attitude, Elderly, Saudi Females.
Introduction
The Kingdom of Saudi Arabia (KSA), is the second-largest Arab state. The population of KSA has increased markedly from 9.8 million in 1980 to approximately 28.8 million in 2013. [1] It is expected that the population of Saudi Arabia will keep on increasing to reach 40.4 million in 2050. [2] The Eastern Province is the largest province of Saudi Arabia, located in the east of the country on the Arabian Gulf coast, with Dammam as the capital. The 2013 population of the Eastern Province was more than 4 million and estimated to be about 4,533,800. The elderly in this region make up around 3.0% of the 2013 total population. [3] Public health services in the Eastern Province are available to all residents. The governmental health services being free of charge for Saudi and non-Saudi.
The elderly have been defined by the World Health Organization (WHO) as the chronological age of 65 or older. [4-7] This definition has been accepted by most of the developed world countries. [8] Rather than lumping together all people who have been defined as old, some gerontologists have recognized the diversity of old age by defining them into sub-groups. According to Zizza, C. A., Ellison, K. J. and Wernette, C. M. (2009), they sub-grouped the elderly into young-old 65-74, middle-old 75-84, and oldest-old 85+. [9] Aging is a dynamic process, which is also genetically determined and environmentally modulated. It involves a rise in susceptibility to develop many chronic diseases and problems with the various functions of the body. Aging has become a phenomenon of population trends with improved health conditions and standard of living.
Review
Life expectancy in KSA was 74 in males and 78 in females in 2012. [10] Thus, life expectancy is increasing dramatically in the Kingdom. Therefore, understanding the elements that affect the way aging is perceived and the attitudes towards the elderly in the kingdom is important. The percentage of the population aged 65+ in Saudi Arabia was between 2.6 percent and 3.6 percent from 1950 to 2005 and stood at 3.0 percent in 2010. [2]
Preconception and injustice facing elders and the dismay of aging remain a universal phenomenon, even though it has been proven by many studies that later adulthood could be a productive and beneficial stage in life. [11] Also, perception towards the elderly is different amongst adults from different age groups, as young adults perceive the elderly in a completely different way than old adults. Young adults are more negative in their rating of elderly subjects compared to the older age group. [12]
Some studies appraise the knowledge of aging, especially amongst students in health and social care courses. Those studies show that students have minimum knowledge about aging. [13] 56.0% of false answered questions portrayed anti-aging bias, in comparison to only 22.0% represent pro-aging bias. [14] However, several studies point out that students joining educational programs such as gerontology courses tend to have more knowledge about aging and affect their attitudes towards older people positively. [15]
Perceptions of the elderly are not the same across all cultures. Middle Eastern cultures such as Arabs are contemplated to possess many collectivist beliefs where communities tend to provide support and care for older people within their families [16]. In a group of 305 Kuwaiti individuals 20 to 64 years of age, only 1.6% believed that the elderly need a geriatric home. This may be reflective of Kuwaiti cultural and religious beliefs about taking care of older people within the family. [17] In contrast, less respect is received from the public to the elderly in Ireland as they do not recognize the beneficiations of the elderly in their community. [18]
Researchers found that the frequency of contact with older individuals reflects their perceptions of aging. [19] A lot of educational programs concentrate on raising the level of contact with the elderly as a means of enhancing perceptions of the elderly and aging. [20] Students who interacted constantly with older adults had more positive attitudes and signified less anti-aging bias than those who did not often interact. [21] Posterior to interference, students acknowledged elders as self-reliant, active, engaged, acceptant, and considered their advice. [20]
To date, little attention has been devoted to the study of attitude and perception of adults towards the elderly. However, the perception of adults toward the elderly is significant and may affect the individual’s attitude towards them. Encountering elders sooner in life can influence older individual’s behavior against their aging process. [22] It is viewed that the knowledge of grandparents’ responsibility towards one’s life will shape and affects the attitude towards the elderly, and the type of attitude towards the elderly will influence the practice of care for the elderly. [23] Moreover, gender likewise seems to be an influence on the behavior of older adults. Research on college students’ behavior and knowledge for the elderly, showed that disregarding the age group of the sample, male students think of older females negatively greater than older male individuals. [24]
Islamic culture teaches children to give special attention and care to their elders. This restrains many from taking elders to the elderly care center. Islamic teaching on elderly rights is very inspiring, however, practice does not consistently show such moral attitudes. Culturally, the Muslim family is extended rather than a nuclear one. A common feature in Middle East countries is that elderly are considered to be a source of wisdom and take their advice seriously. Therefore, it is shameful for them to send an elder parent to an elderly care center as it would defy the religious commitment towards them. Aged care is based on the social solidarity derived from Islam, and those families that have elders must treat them according to Islamic rules. [25] In KSA, the traditional responsibilities of the elderly especially gave the elderly confidence in the past to have power and affected their lives within the family circle. However, the family set-up has changed through time and Saudi families moved into less traditional living environments including the transition from a less extended family set up to a nuclear one. [26]
Study Aim
This study aimed to provide baseline information to those concerned with elderly health in the Eastern Province of Saudi Arabia.
Objectives
Materials and Methods
Type of Study
The study was a cross-sectional study of all Arab females who attended Al-Rashid Mall and Mall of Dhahran in the age group 18-64 years.
Data Collection
Collecting the data was through filling an Arabic self-administered questionnaire by all Arab females who attended the mall in the age group 18-64 years and agreed to participate in the study. Four of the researchers were there in the second week of Ramadan (24 June- 3 July 2015) after Tarawih prayer from 9:30 P.M. till 11:30 P.M. in Al-Rashid Mall and Mall of Dhahran, which are located in Al-Khobar.
Study Population
The population was all Arab females in the age group 18-64 years who attended Al-Rashid Mall and Mall of Dhahran during the study period.
Exclusion Criteria
Illiterate Arab females were excluded from this study.
Sampling
The two malls (Al-Rashid Mall and Mall of Dhahran) out of five malls in Al-Khobar were selected. The latter is the only mall in Dhahran. Half of the sample was taken from each mall. These two malls are the largest malls and the most visited ones in the area. A convenient sampling technique was used to select the study population. A stand was put in each mall to invite females to participate in the study. The participants were given a consent form to sign before completing the questionnaire.
Sample Size
The sample size was selected with the assumption that half of the study population attending the shopping malls will have good knowledge and a positive attitude towards the elderly, with an error of 0.05. The resulting sample size was rounded up to 400 female participants.
The following equation was used to calculate the sample size:
N= (1.96)2 X (P) X (1-P) / (E)2
N= (1.96)2 X (0.5) X (0.5) / (0.05)2= 384.16 ~400
N= sample size, P= prevalence, E= error.
Study Instrument
An Arabic self-administered questionnaire (Appendix 1) was designed specifically for this study. The study variables included socio-demographic data, knowledge, and attitude towards the elderly. The knowledge was mainly concerned with the health problems and diseases among the elderly. It also included knowledge of the availability of health services for the elderly in the Eastern Province, KSA. The diseases and health problems were selected based on those listed by the WHO. An equal number of diseases that are not particularly common in the elderly but affect all ages were added along with those that are particularly common as distractors. The same concept was used for health problems. The questions were designed in a specific way to assess the ability of the respondents to differentiate between them. There were also questions to assess the general knowledge, which were mainly concerned with the starting age of the elderly, the proportion of them in Saudi Arabia, and other related questions. Several statements were put to view the attitude of the respondents towards the elderly.
Ethical Consideration
Ethical approval was obtained from the Research and Ethics Committee at the College of Medicine and Medical Sciences, Arabian Gulf University. (Appendix 2)
Permission was obtained from the chairman of the Family and Community Medicine department to conduct the study. (Appendix 3)
Permission was sought from the administration of each mall.
Statistical Analysis
The data was entered and analyzed using the IBM SPSS software, version 20. A coding system was established and all researchers participated in data entry. The data were further checked for coding errors. Data was analyzed and presented in a tabular and graphical format. A scoring system was used for the 33 questions concerned with knowledge. The questions were scored equally giving each question 1 score. The overall knowledge was calculated by dividing the summation of the correctly answered question over 33 and multiplying it by 100 to get the overall knowledge percentage. A respondent who got 60.0% and above were considered to have good overall knowledge, while those who got less than 60.0% did not have good overall knowledge. Proportions of the results for each test and combined were compared by socio-demographic variables. The Chi-Square, T-test, Mann Whitney, Fisher Exact, and ANOVA were used where applicable to determine statistical significance between the variations of proportions. A p-value of less than 0.05 was considered statistically significant.
Pilot Study
A pilot study was conducted on 20 May 2015 on Arab females in Al-Khobar mall. The questionnaire was distributed to a sample of 50 respondents before the conduction of the study. It was conducted to assess the time that is needed for the respondents to answer the questionnaire and to find out if any difficulties were facing the respondents in filling the questionnaire. Based on the pilot study we re-adjusted the questionnaire, misunderstood questions were fixed and unanswered questions were removed.
Results
Two hundred (50.0%) of the study participants were from Al-Rashid Mall and the other half (200) from Mall of Dhahran. The majority were Saudi females (92.8%), and the rest (7.2%) were from other Arab countries. Table 1 shows that the majority of the respondents (47.3%) were in the age group 21-30 years. Almost two-thirds of the respondents (65.0%) were never married, while 35.0% were ever married. The majority (69.5%) had a bachelor's degree or higher, while only one respondent could just read and write. Those with an educational level of secondary/intermediate were 30.3%. Over three quarters (76.8%) were unemployed and the rest (23.3%) were employed. Among the employed, 19.4% worked in the health profession.
Table 2 shows that 76.5% of the respondents had contact with an elderly person, with the majority (33.0%) having the eldest person in the house in the age group 51-60 years. Those who had a person above 60 years were 18.8%. The rest were distributed in the age groups ≤30-40 years (22.8%) and 41-50 years (25.5%). 32.3% reported having an elderly living with them at home. However, 70.5% of them gave the age of the eldest person as less than 65 years. A statistically significant difference (p <0.001) was found between the elderly living in the house and the age of the eldest person in the house. 15.5% of the respondents’ fathers and 5.8% of the mothers were deceased. Of those whose parents were alive at the time of the study, 40.8% of their fathers’ age group was between 55-64 years, while the mothers’ 41.6% were between 45-54 years.
Over 40.0% of the respondents’ grandparents were 75 years and above (Table 3). Slightly higher proportions of parental grandparents (46.7%, grandfather; 44.7%, grandmother) were in that age category than maternal grandparents (44.3%, grandfather; 42.1%, grandmother).
Figure 1 shows that about one third (31.5%) of the women thought that the starting age of the elderly was 60
years followed by 21.5% who reported it as 70 years. Surprisingly, 12.6% thought that the starting age of the
elderly population was either 50 or 55.
Table 1: Socio-demographic characteristics of the study population
|
Variable |
No. |
% |
|
|
Age |
<=20 |
124 |
31.0 |
|
21 - 30 |
189 |
47.3 |
|
|
31 – 40 |
54 |
13.5 |
|
|
>40 |
33 |
8.3 |
|
|
Total |
400 |
100.0 |
|
|
Marital status |
Single |
260 |
65.0 |
|
Married |
126 |
31.5 |
|
|
Divorced |
10 |
2.5 |
|
|
Widowed |
4 |
1.0 |
|
|
Total |
400 |
100.0 |
|
|
Educational level |
Intermediate or below |
24 |
6.0 |
|
Secondary |
98 |
24.5 |
|
|
University or higher |
278 |
69.5 |
|
|
Total |
400 |
100.0 |
|
|
Employment Status |
Yes |
93 |
23.3 |
|
No |
307 |
76.8 |
|
|
Total |
400 |
100.0 |
|
|
Occupation |
Health profession |
18 |
19.4 |
|
Other |
75 |
80.6 |
|
|
Total |
93 |
100.0 |
|
Table 2: Contact with elderly, age of the eldest person at home and parents
|
|
No. |
% |
|
|
Contact with elderly |
Yes |
306 |
76.5 |
|
No |
94 |
23.5 |
|
|
Total |
400 |
100.0 |
|
|
Age of the eldest person in the house |
<=30 |
44 |
11.0 |
|
31 – 40 |
47 |
11.8 |
|
|
41 – 50 |
102 |
25.5 |
|
|
51 – 60 |
132 |
33.0 |
|
|
>60 |
75 |
18.8 |
|
|
Total |
400 |
100.0 |
|
|
Age of the father if alive |
<45 |
23 |
6.8 |
|
45 – 54 |
103 |
30.5 |
|
|
55 – 64 |
138 |
40.8 |
|
|
65+ |
74 |
21.9 |
|
|
Total |
338 |
100.0 |
|
|
Age of the mother if alive |
<45 |
104 |
27.6 |
|
45 – 54 |
157 |
41.6 |
|
|
55 – 64 |
82 |
21.8 |
|
|
65+ |
34 |
9.0 |
|
|
Total |
377 |
100.0 |
|
Table 3: Age of Paternal and maternal grandparents
|
|
No. |
% |
|
|
Age of paternal grand father if alive |
45 – 54 |
8 |
6.7 |
|
55 – 64 |
26 |
21.7 |
|
|
65 – 74 |
30 |
25.0 |
|
|
75+ |
56 |
46.7 |
|
|
Total |
120 |
100.0 |
|
|
Age of maternal grand father if alive |
45 – 54 |
12 |
9.8 |
|
55 - 64 |
19 |
15.4 |
|
|
65 – 74 |
37 |
30.1 |
|
|
75+ |
55 |
44.7 |
|
|
Total |
123 |
100.0 |
|
|
Age of paternal grand mother if alive |
45 – 54 |
6 |
3.8 |
|
55 - 64 |
22 |
13.9 |
|
|
65 – 74 |
60 |
38.0 |
|
|
75 + |
70 |
44.3 |
|
|
Total |
158 |
100.0 |
|
|
Age of maternal grand mother if alive |
45 – 54 |
7 |
3.3 |
|
55 - 64 |
31 |
14.8 |
|
|
65 – 74 |
83 |
39.7 |
|
|
75 + |
88 |
42.1 |
|
|
Total |
209 |
100.0 |
|
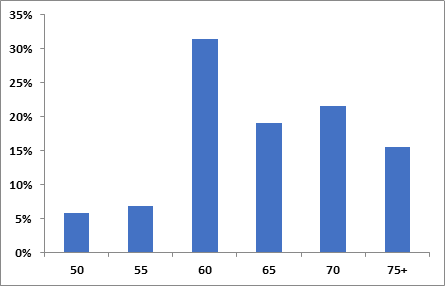
Figure 1: Starting age of the elderly as perceived by the participants
The general knowledge about the elderly in the Eastern Province of Saudi Arabia and the Kingdom is shown in Table 4. Similar percentages (≈33%) were found with the respect to the change (increasing, decreasing, or no change) of the proportion of the elderly population in the Kingdom. Only 3.3% thought that the proportion of the elderly in Saudi Arabia was 5.0%, while almost 40.0% thought it was 25.0%. As for the Eastern Province, the majority (37.3%) thought that the proportion of the elderly ranges between 10-13%, while 13.3% thought it ranged between 3-5%.
Only 18.3% of the study participants had ever visited an elderly care center, while the rest (81.8%) never did. Among those who had visited an elderly care center, 76.7% did not know about the presence of a permanent doctor in the elderly care center, while 93.2% answered correctly about the presence of a social worker. More than half of the respondents (55.0%) gave a correct answer regarding home services for the elderly offered by a health committee in the Eastern Province (Table 5).
Table 4: General Knowledge about the elderly in the Eastern Province, and the Kingdom of Saudi Arabia
|
|
No. |
% |
|
|
Proportion status of elderly in Saudi Arabia |
Increasing |
132 |
33.0 |
|
Decreasing |
134 |
33.5 |
|
|
No change |
134 |
33.5 |
|
|
Total |
400 |
100.0 |
|
|
The proportion of elderly in Saudi Arabia |
5% |
13 |
3.3 |
|
10% |
25 |
6.3 |
|
|
15% |
94 |
23.5 |
|
|
20% |
110 |
27.5 |
|
|
25% |
158 |
39.5 |
|
|
Total |
400 |
100.0 |
|
|
The proportion of the elderly in the Eastern Province of Saudi Arabia |
3 – 5% |
53 |
13.3 |
|
6 – 9% |
122 |
30.5 |
|
|
10 – 13% |
149 |
37.3 |
|
|
14 – 17% |
76 |
19.0 |
|
|
Total |
400 |
100.0 |
|
Table 5: Visits and knowledge about health services provided to the elderly in Eastern Province of Kingdom of Saudi Arabia
|
|
Yes |
No |
||
|
No. |
% |
No. |
% |
|
|
Ever visited an elderly care center |
73 |
18.3 |
327 |
81.8 |
|
There is a permanent doctor in the elderly care center |
56 |
76.7 |
17 |
23.3 |
|
There is a social worker in the elderly care center |
68 |
93.2 |
5 |
6.8 |
|
The health committee offers home services for the elderly |
220 |
55.0 |
180 |
45.0 |
Figure 2 shows the knowledge about the common diseases that affect the elderly. 78.0% knew that diabetes is one of the diseases that affect the elderly. It was followed by heart problems (66.3%) and hypertension (64.3%). Parkinson’s disease was the least identified (6.3%) as a common disease of the elderly. Concerning diseases that are not associated with the elderly the majority (≥85.8%) gave correct answers. It ranged from 85.8% in asthma to 99.5% in meningitis.
Figure 3 shows the knowledge about the common health problems that affect the elderly is shown in Figure 3. 74.8% knew that visual problem is one of the health problems that affect the elderly, followed by hearing defects (61.3%). The least identified common health problem was fractures (21.0%). Concerning health problems that are not associated with the elderly, the majority (≥86.0%) gave correct answers. It ranged from 86.0% in smoking to 98.0% in burns.
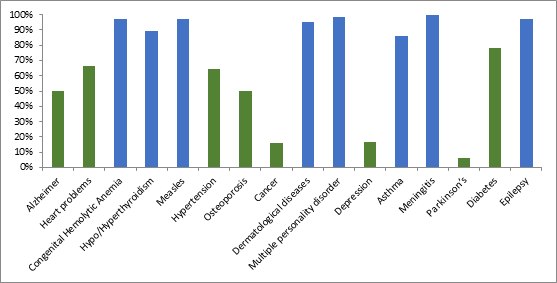
Figure 2: Knowledge about diseases of the elderly
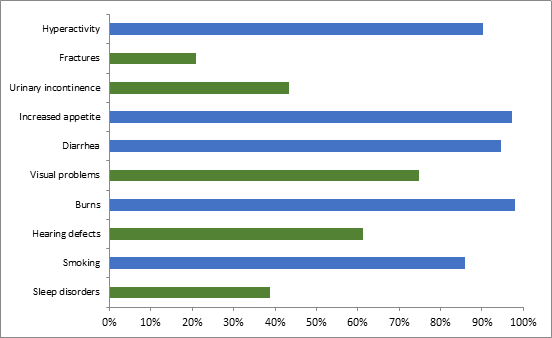
Figure 3: Knowledge about elderly health problems
Figure 4 shows the respondents’ attitudes towards the elderly. 80.8% replied “always” for the statement “elderly people must live with their families”. Only one stated “never” to the former statement. More than half of the women answered “never” to placing the elderly in a nursing home as acceptable. On the statement “elders depend on people around them” 47.5% stated “often” and 31.0% “always”. Over the half thought that listening to elders’ repeated stories is always fun. There were variations in answering both statements “the financial status affects elderly treatment” and “elders get mistreated by the society”. There is no statistical significance between the respondents’ age, occupation, and contact with the elderly and their attitude towards the elderly. On the other hand, it was statistically significant that their marital status (p= 0.027), educational level (p= 0.002), and employment (p= 0.019) affected their attitude towards the elderly.
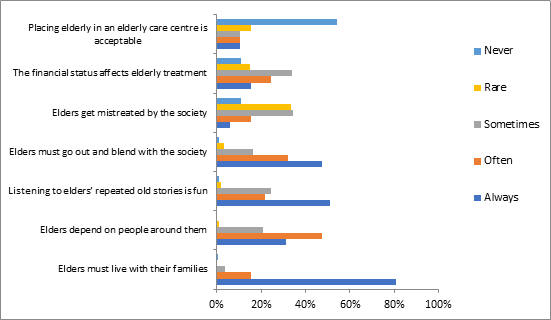
Figure 4: Attitude towards elderly
61.3% of the women had good overall knowledge (answering 60.0% or more of the knowledge questions correctly). The relationship between overall knowledge and personal data is shown in Table 6. There was no variation in overall knowledge towards the elderly by age, marital status, working status, and contact with the elderly. However, there were statistically significant differences concerning educational level (p= 0.004) and working in a health profession (p= 0.013).
Table 6: Relationship between overall knowledge and personal data
|
|
Overall knowledge |
|
P-value |
||
|
Mean |
SD |
||||
|
Age(1) |
<=20 |
60.82 |
8.71 |
|
0.089 |
|
21 – 30 |
62.86 |
9.44 |
|||
|
31 – 40 |
63.33 |
9.25 |
|||
|
>40 |
64.58 |
9.12 |
|||
|
Marital Status(2) |
Never married |
62.16 |
9.09 |
|
0.421 |
|
Ever married |
62.94 |
9.44 |
|||
|
Educational level(2) |
Secondary or below |
60.42 |
9.00 |
|
0.004 |
|
University or higher |
63.31 |
9.18 |
|||
|
Employment status(2) |
Yes |
63.91 |
9.27 |
|
0.077 |
|
No |
61.98 |
9.16 |
|||
|
Occupation(3) |
Health related |
68.69 |
10.95 |
|
0.013 |
|
Other |
62.76 |
8.51 |
|||
|
Contact with Elderly(2) |
Yes |
62.59 |
9.17 |
|
0.521 |
|
No |
61.90 |
9.38 |
|||
(1) ANOVA
(2) T-test
(3) Mann Whitney
Discussion
The results of the study were based on data obtained from literate Arab females who attended AlRashid Mall and Mall of Dhahran in the Eastern Province. The findings cannot be generalized to all females in the Eastern Province in the age group 18-64 years as almost one-third of the study population was from 18 to 20 years. This was expected as more young females go to the malls during the holy month of Ramadan. However, both malls are the most visited by the Eastern Province population. The results of the study provided an opportunity to compare the public’s knowledge and attitude toward the elderly in many aspects across the age categories, marital status, educational level, employment, occupation, and contact with the elderly.
The majority (78.3%) of the women were from 18-31 years. This finding is not in accordance with the female population distribution of Saudi Arabia where approximately 30.0% are in this age group. Further, 69.5% of the women had a bachelor’s degree or higher, which is in contrast to the female general population (19.0%). The fact that 79.8% of the women were unemployed is not surprising. It is close to that of the general population of Saudi Arabia, were 60.3% of the unemployed are females. [3]
The more educated university graduate respondents had better overall knowledge when compared to those with secondary/lower educational levels. A previous study of students attending health and social care courses showed that 56.0% incorrectly answered questions reflecting anti-aging, were only 22.0% represented pro-aging. [14]
Less than one-quarter of the study participants (23.3%) were employed. Among the employed, 19.4% were in health professions. When comparing the overall knowledge among the employed we found that those in health professions had better overall knowledge. This finding is in accordance with a study done on students joining gerontology courses who had more knowledge about aging. [15]
The majority (76.5%) of the women had contact with the elderly. When we compared the overall knowledge of those respondents to the rest, there was no statistical significance. This finding was unexpected as the literature emphasizes the relationship between contact with the elderly and knowledge and attitude towards them. One study was conducted on students who interacted constantly with the elderly. Showed that those students had a more positive attitude, and signified less anti-aging bias compared to those who communicated less regularly. [21]
The majority of the women (80.8%) thought that it is never acceptable to place an elderly in a nursing home. This attitude is influenced by religious beliefs and cultural values. The teachings of Islam direct children to care for their parents and elderly parents in particular. This prevents many from sending the elderly to an elderly care center. [27] In Surah Al-Israa (17:23) from the Holy Quran, "Thy Lord hath decreed that ye worship none but Him, and that ye be kind to parents. Whether one or both of them attain old age in thy life, say not to them a word of contempt, nor repel them, but address them in terms of honour." A similar attitude was reported by Kuwaiti adults when only 1.6% believed that the elderly need a geriatric home. [17] This was expected as Kuwait is similar in culture and has the same religion as Saudi Arabia.
97.4% of the women aged 21-30 years thought that the elderly must “always or often” live with their families, while 93.9% of the women aged 40+ years had similar thoughts. Surprisingly, 6.0% of the women from the age group 40+ years reported that the elderly must “sometimes/rarely or never” live with their families. On the other hand, only 2.6% of the women aged 21-30 years had similar views.
The study findings showed that for most items, age, occupation, and contact with the elderly were not related to women’s attitudes; in contrast to the marital status, educational level, and employment. Similarly, a previous study among pharmacy students found that all demographic factors except gender were not related to the students’ attitudes towards the elderly. Also, several studies among dental and medical students did not find a relationship between demographic factors and attitudes. [28]
The study's limitations were mostly the timing of data collection, which was in the middle of the holy month of Ramadan. In this month adults usually spend more time at mosques and particularly tarawih, the special Ramadan prayer. They also visit relatives and friends and watch Ramadan special television programs. Hence, their attendance at shopping malls during this period is usually lower than in other months. Thus, the majority of the study population were in the younger age group as they are the ones whose visits to the malls are least affected. Also, the timing coincided with the summer months where many people in Saudi Arabia travel abroad.
Conclusion and Recommendation
In conclusion, the results showed that there was a lack of knowledge of the starting age of the elderly among women. However, the majority had a good overall knowledge score. Their knowledge was positively influenced by their educational level and having a health profession. Most of the women thought that the elderly should be cared for at home. However, the awareness of the available services to the elderly in the Eastern Province of the Kingdom was not optimal. The information that the participant had regarding the common diseases and health problems among the elderly was relatively good. The Ministry of Health should aim to raise society’s awareness of the available services for the elderly. The Ministry of education needs to consider incorporating elderly health in the social studies and life sciences programs. It also needs to encourage the students to celebrate the elderly annually and visit elderly care centers.
Acknowledgment
Highest regard and appreciation goes to our research supervisor Prof. Randah Hamadeh, who provided us with continuous guidance, support, and feedback during the whole course of the research from developing the idea to implementing the study and later to the final stage. Her efforts are highly appreciated and her guidance was decisive in conducting and creating this study. We would also like to thank Dr.Ahmed Jaradat and Dr. Amer Marabha who helped us with statistics and SPSS. Our thanks are extended to all those women who participated in this study. In the end, many thanks and regards to AlRashid Mall and Mall of Dhahran in Al-Khobar for welcoming and allowing us to conduct the study there.
References
Shepherd M D, Erwin G. An examination of students' attitudes toward the elderly. Am J Pharm Educ 1983;47(1): 35–38.