Pharmacophore an International Research Journal
Effects of Phenol Red on Rifampicin-Induced Expression of Cytochrome P450s Enzymes
Nathaphon Kuncharoenwirat1, Waranya Chatuphonprasert2, Kanokwan Jarukamjorn1*
|
|
|
Abstract
The hepatocarcinoma (HepG2) and colorectal adenocarcinoma (Caco-2) cell lines are widely used for pharmacokinetic and pharmacodynamic modeling of xenobiotic metabolism in human liver and intestine. Phenol red is commonly contained in cell culture medium as a pH indicator, however, the impact of phenol red on the expression of metabolic and transporter associated genes in cell models is limited. This study examined the effect of phenol red on the rifampicin-induced expression of four cytochrome P450 (CYP) enzymes (CYP1A2, CYP2E1, CYP3A4, and CYP3A5), the solute carrier organic anion transporter 1B1 (SLCO1B1), and three nuclear receptors related to the regulation of metabolism (pregnane X receptor PXR, aryl hydrocarbon receptor AhR, and constitutive androstane receptor CAR) in HepG2 and Caco-2 cells. HepG2 (1.25×10⁵ cells/well) and Caco-2 (5×10⁴ cells/well) were cultured in phenol-red containing medium in 24-well plates for 72 hours before induction with rifampicin (5 µM) in phenol red-containing or phenol red-free media for 72 hours. Total RNA was reverse transcribed and expression of the target genes was determined by RT/qPCR. Phenol red suppressed induction of CYP3A4, CYP3A5, and AhR mRNA by rifampicin in both HepG2 and Caco-2 cells, and suppressed rifampicin-induced CYP1A2 expression in HepG2 cells and rifampicin-induced expression of CYP2E1 and SLCO1B1 in Caco-2 cells. Rifampicin did not induce expression of the PXR and CAR nuclear receptors in either medium. The different effects of phenol red on the regulation of CYP1A2, CYP2E1, and SLCO1B1 in HepG2 and Caco-2 cell lines is therefore an important factor to consider when using these cell lines for pharmacokinetic and pharmacodynamic modeling of xenobiotics.
Keywords: AhR, CYP1A2, CYP2E1, CYP3A, SLCO1B1
Introduction
Cell-models of xenobiotic metabolism and transport are useful for preclinical screening of xenobiotic pharmacokinetics and for identifying potential drug interactions. [1] Phase I cytochrome P450 enzymes (CYP) and membrane drug transporters are the main factors affecting the bioavailability of therapeutic drugs, and disturbance of their functions can lead to clinical problems. [1, 2]
Human cell lines are widely used [3-5] to represent human organs in vitro for drug development [6], pharmacokinetic and pharmacodynamic modeling, and to investigate drug interactions. [7, 8] The HepG2 (hepatocarcinoma) and Caco-2 (colorectal adenocarcinoma) cell lines are commonly used as models for metabolism and absorption of xenobiotics in the human liver and intestine, respectively. [7, 9] Both HepG2 and Caco-2 cells express phase I metabolizing enzymes including CYP1A2, CYP2E1, CYP3A4, and CYP3A5, influx and efflux drug transporters including solute carrier organic anion transporter 1B1 (SLCO1B1), and nuclear receptors including pregnane X receptor (PXR), aryl hydrocarbon receptor (AhR), and constitutive androstane receptor (CAR). [7, 9-11]
Phenol red (Figure 1A) is added to commercial cell culture media as a pH indicator. [12, 13] At human physiological pH 7.4, phenol red appears bright red, which changes to yellow in acidic conditions in the presence of waste products from cell growth. [14] Phenol red possibly exhibits a weak estrogenic action due to its structure mimicking that of the non-steroidal estrogenic hormones 17-b-estradiol and bisphenol, both of which can activate the estrogen receptor (ER). This can increase cell proliferation and interfere with treatments in cells, particularly anti-cancer drugs. [12, 14] Therefore, most studies investigating therapeutics in cell lines use phenol red-free medium for the duration of the treatment period to avoid the above effects. [15]
Rifampicin (Figure 1B) is the standard treatment for tuberculosis, but it has a high incidence of drug-interaction due to its capability to induce and inhibit various CYPs and drug transporters. [16] Rifampicin is a transcriptional inducer of multiple CYPs including CYP1A, CYP2B, CYP2C, and CYP3A [16, 17] and it has been widely used in human cell line models. [16] However, the effect of phenol red on the expression of CYPs, the SLCO1B1 transporter, and nuclear receptors in human cell line models needs to be studied. [13] The present study investigated the effects of phenol red on the rifampicin-induced expression of CYP1A2, CYP2E1, CYP3A4, CYP3A5, the SLCO1B1 transporter, and nuclear receptors PXR, AhR, and CAR in HepG2 and Caco-2 cells.
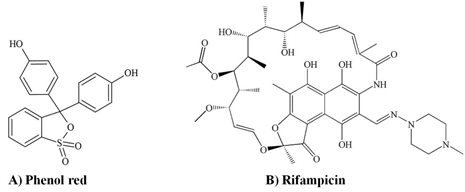
Figure 1 Structure of (A) phenol red and (B) rifampicin.
Materials and Methods
Chemicals
Dulbecco’s modified Eagle medium with phenol red (DMEM with phenol red, Cat. No. 11885-084), Dulbecco’s modified Eagle medium nutrient mixture F-12 without phenol red (DMEM/F-12 without phenol red, Cat. No. 21041-025), fetal bovine serum (FBS), Glutamax®, non-essential amino acids (NEAA), 1× phosphate-buffered saline, and trypsin-EDTA were products of Gibco® (Grand Island, NY, USA). Rifampicin was purchased from Sigma-Aldrich Chemical (St. Louis, MO, USA). ReverTra Ace® was a product of Toyobo Co., Ltd. (Osaka, Japan). Taq DNA polymerase and dNTP mixture were products of Vivantis Technologies (Selangor Darul Ehsan, Malaysia). SYBR® Green I was supplied by Invitrogen Life Technologies (Carlsbad, CA, USA). All other laboratory chemicals were of the highest purity from commercial suppliers.
Experimental design and treatments
HepG2 cells (ATCC HB-8065, Manassas, USA) were cultured in DMEM supplemented with 10 % FBS, 1× Glutamax®, 110 units/mL penicillin and streptomycin while Caco-2 cells (RIKEN RBRC-RBC0988, Saitama, Japan) were cultured in DMEM supplemented with 20 % FBS, 1× Glutamax®, 1× NEAA, 110 units/mL penicillin and streptomycin. HepG2 (1.25´105 cells/well, n=4) and Caco-2 (5´104 cells/well, n=4) cells were seeded in 24-wells plates under sterile conditions of 95% relative humidity, 37 °C, and 5% CO2 for 72 hours before treatment. A stock solution of rifampicin (5 mM) was dissolved in dimethyl sulfoxide (DMSO) and diluted with medium to 5 µM. There were 4 treatment groups for each cell line; 1) phenol red control, treated with 0.1% DMSO in DMEM with phenol red, 2) phenol red rifampicin, treated with 5 µM rifampicin in DMEM with phenol red, 3) phenol-free control, treated with 0.1% DMSO in DMEM/F-12 without phenol red, and 4) phenol-free rifampicin, treated with 5 µM rifampicin in DMEM/F-12 without phenol red. Cells were incubated in 95% relative humidity, at 37 °C and 5% CO2 for 72 hours before harvesting.
Quantitative determination of mRNA expression by reverse transcription and real-time polymerase chain reaction (RT/qPCR)
The total RNA was extracted from the cells by guanidinium thiocyanate-phenol-chloroform extraction method [18] before measuring concentration by a NanoDrop 2000C UV-Vis spectrophotometer (Thermo Fisher Scientific, Waltham, MA, USA). Total RNA (500 ng) was reverse transcribed to cDNA using ReverTra Ace® under the conditions recommended by the supplier (Toyobo Co., Ltd.) at 25 °C for 10 min, 42 °C for 60 min, and 95 °C for 5 min. Expression of CYP1A2, CYP2E1, CYP3A4, CYP3A5, SLCO1B1, PXR, AhR, and CAR mRNA was determined by a real-time PCR machine CFX96 Touch™ (Biorad, Hercules, CA, USA) coupled with Bio-Rad-CFX manager version 3.1 program. The qPCR reaction mixture was composed of 0.07 unit/µL Taq DNA polymerase, 1.67 mM MgCl2, 0.06 mM dNTP mixture, 0.22 µM specific forward and reverse primers of each gene (Table 1), and SYBR® Green I (1:7,500). The mRNA expression of targeted genes was amplified under the four steps-program consisting of warming up at 95 °C for 1 min, denaturation at 95 °C for 20 s, annealing at the optional temperature for each specific gene (Table 1) for 20 s, and extension at 72 °C for 20 s. The selectivity of primers was confirmed by melting curve temperature. The results are reported as fold-differences of the mRNA expression of the target gene normalized with that of the reference gene (Glyceraldehyde 3-phosphate dehydrogenase, GAPDH).
Statistical analysis
Results are presented as mean ± standard deviation (SD) (n=4). Statistical analysis of difference was performed by one-way ANOVA with Tukey’s statistical post hoc test at significance levels p < 0.05 and p < 0.001 using IBM Statistical Package for the Social Sciences (SPSS) version 23.0 (Armonk, USA).
Table 1: Forward and reverse primers for qPCR.
|
Genes |
Primers (5′ ® 3′) |
Annealing temperature (°C) |
References |
|
|
CYP1A2 |
Forward |
ACAAGGGACACAACGCTGAA |
60.0 |
[19] |
|
Reverse |
AGGGCTTGTTAATGGCAGTG |
|
||
|
CYP2E1 |
Forward |
AATGGACCTACCTGGAAGGAC |
60.0 |
[19] |
|
Reverse |
CCTCTGGATCCGGCTCTCATT |
|
||
|
CYP3A4 |
Forward |
GCCTGG TGCTCCTCTATCTA |
54.7 |
[19] |
|
|
Reverse |
GGCTGTTGACCATCATAAAAG |
|
|
|
CYP3A5 |
Forward |
CCTGAACCTCTCAGGAGCATTT |
61.1 |
[20] |
|
|
Reverse |
GGCTGTTGACCATCATAAAAG |
|
|
|
SLCO1B1 |
Forward |
GAATGCCCAAGAGATGATGCTT |
60.0 |
[19] |
|
|
Reverse |
AATCCAGTGCAAGTGATTTCAAT |
|
|
|
PXR |
Forward |
ATGATCATGTCCGACGAGGC |
60.5 |
[20] |
|
|
Reverse |
CCTGATCATCATCCGCTGCT |
|
|
|
AhR |
Forward |
CAACAGCAACAGTCCTTGGC |
60.5 |
[21] |
|
|
Reverse |
GTTGCTGTGGCTCCACTACT |
|
|
|
CAR |
Forward |
AGGACCAGATCTCCCTTCTCAAG |
58.0 |
[21] |
|
|
Reverse |
CGTGTTTGGAGACAGAAAGTGGTA |
|
|
|
GAPDH |
Forward |
CACCATCTTCCAGGAGCGAG |
61.1 |
[19] |
|
|
Reverse |
GACTCCACGACGTACTCAGC |
|
|
Results and Discussion
Effects of phenol red on the rifampicin-induced expression of CYP1A2, CYP2E1, CYP3A4, and CYP3A5 in HepG2 and Caco-2 cells.
CYP1A2 is abundantly expressed only in the liver. [2] The HepG2 cell line has been used as a correlate for human CYP1A2 induction by polycyclic aromatic hydrocarbons, omeprazole, rifampicin, and ritonavir. [2, 22]. HepG2 cells and human hepatocytes treated with rifampicin (50 µM) showed 1.9- and 2.3-fold increases in 7-ethoxyresorufin-O-demethylase responsive CYP1A2 activity, respectively. [22, 23] This corresponded with our observation that rifampicin increased CYP1A2 expression in HepG2 cells in both the phenol red (p < 0.05) and phenol red-free media (p < 0.001) (Figure 2A). Furthermore, expression of CYP1A2 mRNA was higher in phenol red-free than phenol red media (p < 0.001), presumably because of the estrogenic effect of phenol red suppressing CYP1A2 expression. In contrast, rifampicin did not induce expression of CYP1A2 in Caco-2 cells (Figure 2A) in either medium, probably because of the low abundance of CYP1A2 in Caco-2 cells. [24]. Therefore, HepG2 cells should be cultured in phenol red-free medium to investigate rifampicin induced CYP1A2 expression.
CYP2E1 is a major CYP isoform in the liver [2, 25] and is normally inducible by alcohol and small hydrophilic compounds. [25] In this study, the mRNA levels of CYP2E1 in HepG2 cells were not changed by rifampicin in either phenol red or phenol red-free media (Figure 2B). This may be because rifampicin is not a specific ligand for hepatic CYP2E1. An observation that is supported by a previous study in human primary hepatocytes that showed rifampicin (10 µM) did not change the expression of CYP2E1. [26] In contrast, rifampicin significantly elevated the expression of CYP2E1 in Caco-2 cells, but only in phenol red-free medium (p < 0.001) (Figure 2B). This suppression of CYP2E1 expression might be due to the similarity in structure between 17b-estradiol and phenol red. A previous study demonstrated that CYP2E1 expression was suppressed by 17b- estradiol in ovariectomized CYP2E1-humanized mice. [27]

Figure 2: Effect of phenol red on the expression of CYP1A2 and CYP2E1 mRNA in HepG2 and Caco-2 cells. Control, 0.1% dimethyl sulfoxide; RIF, rifampicin 5 μM. *p < 0.05, **p < 0.001 vs Control; #p < 0.001.
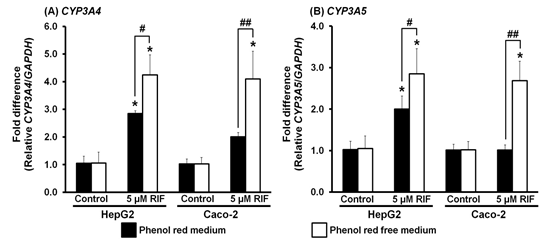
Figure 3. Effect of phenol red on the expression of CYP3A4 and CYP3A5 mRNA in HepG2 and Caco-2 cells. Control, 0.1% dimethyl sulfoxide; RIF, rifampicin 5 μM. *p < 0.001 vs Control; #p < 0.05, ##p < 0.001.
CYP3A, which includes two isoforms CYP3A4 and CYP3A5, is the most abundant subfamily of CYPs in the liver. [2] Rifampicin is known as the keystone of CYP3A4 and CYP3A5 induction in the human liver and intestine. [2, 20] A previous study showed that expression levels of CYP3A4 and CYP3A5 were elevated 4 and 1.9 folds, respectively, in HepG2 cells after treatment with rifampicin (12.15 µM) for 4 days. [28] Furthermore, PXR transfected Caco-2 cells treated with rifampicin (10 µM) for 14 days showed an increase in CYP3A4 expression. [29] Our findings were consistent with these studies. We found that HepG2 cells treated with rifampicin demonstrated significant increases in CYP3A4 and CYP3A5 expression in both phenol red and phenol red-free media (p < 0.001) (Figure 3). Furthermore, expression levels of CYP3A4 and CYP3A5 were higher in phenol red-free medium than in phenol red medium (p < 0.05) (Figure 3). Similarly, rifampicin increased expression of CYP3A4 and CYP3A5 mRNAs (p < 0.001) in Caco-2 cells, but only in phenol red-free medium (Figure 3). Therefore, it can be inferred that rifampicin induces expression of CYP3A4 and CYP3A5 in HepG2 and Caco-2 cells via the same regulatory pathway. The reduced induction of CYP3A4 and CYP3A5 by rifampicin in phenol red medium might due to the non-steroidal estrogen-like structure of phenol suppressing expression. A previous study showed that hepatic CYP3A4 and CYP3A5 were expressed at lower levels in females than in males, possibly due to the presence of estrogen hormone. [30] However, other factors including CYP3A5 polymorphisms, age, and dietary intake may have also contributed to this finding. [30, 31]
Effects of phenol red on the rifampicin-induced expression of SLCO1B1 in HepG2 and Caco-2 cells.
SLCO1B1 is the gene encoding the SLCO1B1 transporter, which plays an important role in the uptake of rifampicin into the cell. Rifampicin is also a substrate of the SLCO1B1 transporter and can induce a compensation process in Caco-2 cells that increases the expression of SLCO1B1. [32] In the present study, expression of SLCO1B1 mRNA in HepG2 cells was not changed by rifampicin in either phenol red or phenol red-free media (Figure 4A). This corresponded with a study that showed no induction of SLCO1B1 expression by rifampicin (10 µM) in human hepatocellular carcinoma Huh-7 cells. [33] In contrast, the expression of SLCO1B1 in Caco-2 cells was significantly elevated by rifampicin in phenol red-free medium (p < 0.001), but not in phenol red medium (Figure 4A). The estrogen-like structure of phenol red may have interfered with the up-take of rifampicin into the cells. Estrogens are also substrates of SLCO1B1 and they could compete with rifampicin to enter the cells via SLCO1B1. [34]. Therefore, Caco-2 cultured in phenol red-free medium is suggested as the appropriate model for rifampicin-induced SLCO1B1 expression.
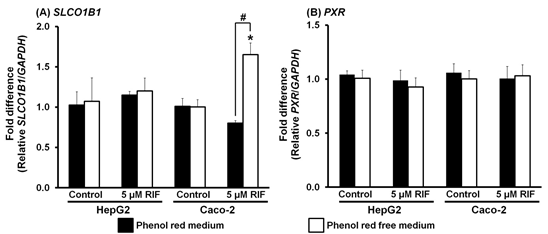
Figure 4. Effect of phenol red on the expression of SLCO1B1 and PXR mRNA in HepG2 and Caco-2 cells. Control, 0.1% dimethyl sulfoxide; RIF, rifampicin 5 μM. *p < 0.001 vs Control; #p < 0.001.
Effects of phenol red on the rifampicin-induced expression of PXR, AhR, and CAR in HepG2 and Caco-2 cells.
Rifampicin is a specific PXR ligand. Activated PXR subsequently forms a heterodimer with retinoid X receptor (RXR) to mediate the transcription of CYPs, especially CYP3A4 and CYP3A5. [2, 16, 35] However, in the present study, rifampicin did not modify PXR expression in either HepG2 or Caco-2 cells in either phenol red or phenol red-free media (Figure 4B), in contrast to the increased expression seen for CYP3A4 and CYP3A5 (Figure 3). These observations support previous reports where treatment with rifampicin (10 or 20 µM) for either 72 or 48 h did not modify PXR expression due to the low abundance of PXR in HepG2 and Caco-2 cells. [36, 37] A previous study reported that PXR-transfected HepG2 cells showed a 13-fold increase in PXR expression. [38] Therefore, in the current study, induction of CYP3A4 and CYP3A5 expression by rifampicin in HepG2 and Caco-2 cells must have been mediated through other regulatory pathways such as AhR or the vitamin D receptor. [20, 37] The low abundance of PXR in HepG2 and Caco-2 cells means that these cell lines are not suitable models for investigating the induction of PXR expression by rifampicin regardless of the presence or absence of phenol red in the medium.
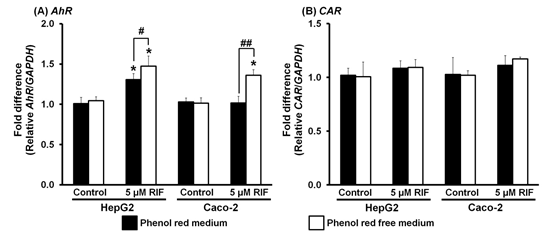
Figure 5. Effect of phenol red on the expression of AhR and CAR mRNA in HepG2 and Caco-2 cells. Control, 0.1% dimethyl sulfoxide; RIF, rifampicin 5 μM. *p < 0.001 vs Control; #p < 0.05, ##p < 0.001.
The expression of AhR in HepG2 cells was significantly elevated in both phenol red and phenol red-free media (p < 0.001) (Figure 5A), with higher induction of AhR expression in phenol red-free medium (p < 0.05) (Figure 5A). AhR is the most common nuclear receptor found in the liver and the major regulator of CYP1A expression. [39] Therefore, increasing AhR expression should lead to CYP1A induction. In the present study, both CYP1A2 and AhR expression were induced by rifampicin in HepG2 cells in both phenol red and phenol red-free media, although the amount of induction was higher in phenol red-free medium for both genes (Figures 2A and 5A). In contrast, the expression of the mRNA in Caco-2 cells was up-regulated by rifampicin only in phenol red-free medium (p < 0.001) (Figure 5A). Interestingly, the induction of AhR in HepG2 and Caco-2 cells (Figure 5A) corresponded with the induction of CYP3A4 (Figure 3A) and CYP3A5 (Figure 3B). These observations suggest cross-talk between PXR and AhR activation of rifampicin, although this is still controversial. [40] Our findings are consistent with a previous study showing the induction of CYP3A4 and CYP3A5 by rifampicin (0.5-10 µM) in HepG2 cells corresponded with the induction of AhR, with no induction of PXR expression. [20] Therefore, the regulatory mechanism for CYP3A4 and CYP3A5 expression by rifampicin in HepG2 and Caco-2 cells might involve the AhR pathway, at least in part. The increased induction of AhR in phenol red-free medium is likely to be due to the estrogenic effects of phenol red binding with estrogen receptor (ER), resulting in AhR and ER interaction during regulation. [14, 41]
Expression of CAR in HepG2 and Caco-2 cells was not altered by rifampicin in either phenol red or phenol red free media (Figure 5B). Although PXR-CAR crosstalk by rifampicin activation exists, [16, 42] no induction of CAR expression was noted in livers, lungs, and kidneys of pigs treated with rifampicin (40 mg/kg/day) for 4 days. [43] Hence, induction of CYPs (e.g. CYP1A2, CYP2E1, CYP3A4, and CYP3A5) and SLCO1B1 might occur separately from CAR activation through AhR and/or other nuclear receptors such as the hepatocyte nuclear factor 4a, the glucocorticoid receptor, and the vitamin D receptor [16, 20].
Conclusion
Phenol red is one factor that can influence CYP1A2, CYP2E1, CYP3A4, CYP3A5, SLCO1B1, and AhR induction by rifampicin via its estrogenic effects and depend on the abundance of the genes. The impact of phenol red on the induction of CYP1A2, CYP2E1, and SLCO1B1 by rifampicin was different between HepG2 and Caco-2 cells. The suppressive effect of phenol red on CYP1A2 only occurred in HepG2 cells, while phenol red suppression of CYP2E1 and SLCO1B1 only happened in Caco-2 cells. Conversely, phenol red suppression of CYP3A4, CYP3A5, and AhR induction was consistent in HepG2 and Caco-2 cells. Further study of factors such as the origin of the cell line, gene polymorphisms, crosstalk between nuclear receptors, and alternative activation mechanisms of CYPs, transporters, and nuclear receptors is needed to improve understanding of phenol red interference in gene expression in cell lines.
Acknowledgments
NK sincerely acknowledges the Graduate School of Khon Kaen University for the scholarship (621JH103) and Research Group for Pharmaceutical Activities of Natural Products using Pharmaceutical Biotechnology (PANPB), Faculty of Pharmaceutical Sciences, Khon Kaen University for the research grant and facilities. The authors thank Dr. Glenn Borlace, Faculty of Pharmaceutical Sciences, Khon Kaen University for English language assistance.
References