Pharmacophore an International Research Journal
Kinetin Efficacy Indices for Photosynthetic Phytochemicals and Mash Beans’ Water Relations
Ghulam Yasin*, Farah Akmal, Saima Aslam, Samia Khan, Sana Anwer, Aqsa Khan
|
|
Department of Botany, Bahauddin Zakariya University, Multan, Pakistan. |
Abstract
The experiment was managed for finding the Kinetin efficacy indices to draw its dose-response curves accompanied by emphasize on plant genotypic variations by their response. Four genotypes i.e., MASH 80, MASH 88, MASH 97 and MASH ES-1 were sprayed thrice with Kinetin concentrations of 25.0, 50.0, 75.0, 100.0, 125.0, and 150.0 mgL-1. Plants were grown in pots filled with sandy loam soil. Pots by number were replicated four times for each concentration and were randomized completely by their placement design. Data were measured on the expiry of ten days after completion of Kinetin spray. Data revealed that chlorophyll-a concentration was significantly influenced by all levels of Kinetin while the least significant doses for carotenoids and chlorophyll b increase were 75mgL-1 and 100 mgL-1 respectively. When plotted against Kinetin levels, change in chlorophyll-a concentration was linear except in MASH 80 where sigmoidal expression was observed like in all genotypes for other pigments. MASH 80 responded at the most for change in pigments concentration while MASH ES-1 was least responding genotype in this regard. A significant change in water potential started at 100 mgL-1. Change in water potential and osmotic potential of all genotypes was sigmoidal for Kinetin levels except in plants of MASH 88. The genotypic variation was found consistently.
Keywords: carotenoids, chlorophyll, Kinetin, osmotic potential, vigna, water potential
Introduction
Among the phytohormones, Kinetins are a class of low molecular weight compounds [1, 2] that have vital importance in regulating plant growth [3] and development [4, 5]. Cytokinins are involved in manyfunctions such as regulating cell division, apical dominance, development, morphogenesis, germination, nutrients uptake, assimilate, and delay senescence. Cytokinin by binding to membrane-bound receptors initiates signal transduction [6-8].
Kinetin alone sometimes can control a variety of physiological, metabolic, biochemical, and developmental processes when applied to plants [9]. Kinetin may be active in the presence of other hormones [10, 11] and is influenced, however, by the exogenous application of other bioregulators. Foliar application of Kinetin improves leaf water status by enabling the roots to access moisture normally not available to plants. The Kinetin enhances chlorophyll contents by its effects on chlorophyll synthesis and by control of its degradation [12,13]. The effect of Kinetin on improving carotenoids contents has also been reported [14].
One of the most important experiments in plant hormonal physiology is the dose-response curve as plant hormones characteristically exhibit a wide activity range for a given concentration [15]. Plant age, at which hormones are applied, the concentration of hormones and mode of application, in addition to other factors, are crucial in determining the optimum effective concentration of hormones.
Black gram [Vigna mungo (L.) Hepper], a self-pollinating and widely cultivated grain legume [16], is one of the important pulse crops. It is a cheap source of protein for direct human consumption and of economic value. Keeping in view the importance of Mash bean [Vigna mungo (L.) Hepper] and considering the variation in Kinetin dose-response; the present study was designed to find out dose-response curves for various Kinetin concentrations.
Materials and Methods
The experiment was devised to find out Kinetin efficacy for chlorophyll a, chlorophyll b, total carotenoids, leaf water potential and leaf osmotic potential of four [Vigna mungo (L.) Hepper] genotypes to evaluate the expression of various dose-response curves for exogenous Kinetin application.
Materials
After the initial survey, soil free from effluents hazards was selected for the experiment. The soil was air-dried ground, passed through 2mm sieve, and mixed well. Seeds of four Mash genotypes i-e MASH 80, MASH 88, MASH 97, and MASH ES-1 were used in the experiment. The genotypes have their origin in Ayub Agricultural Research Institute (AARI), Faisalabad (Pakistan), and National Agricultural Research Centre (NARC) Islamabad (Pakistan). These were obtained from Pulse Section, Ayub Agricultural Research Institute (AARI), Faisalabad (Pakistan). Kinetin, 6-Furfuryl-aminopurine (C10H9N5O) of Sigma Aldrich, Japan was used.
Methods and layout plan
The experiment was conducted with a completely randomized design of treatments to avoid unequal exposure to environmental factors. Each treatment was repeated four times by pots. Pots of 30 cm diameter were used. Each pot was filled with 10 kg sandy loam soils and lined with polyethylene bags ensuring prevention of seepage. Sterilized seeds, similar in size and weight, of each genotype, were germinated. Eight seeds were sown in each pot making 2cm deep holes with the help of a wooden stick having 1.5cm diameter. Each seed was covered with a small amount of soil for a proper supplement of germination factors. Thinning was performed to maintain one seedling in each pot to avoid the imbalanced uptake of nutrients by plants. Insects and pests were controlled by foliar spray of Thiodon insecticides of Hoechst (Pvt) Ltd, Pakistan. Plants were irrigated with normal irrigation water. By reviewing the published literature, concentrations of Kinetin selected for the experiment were 25.0, 50.0, 75.0, 100.0, 125.0, and 150.0 mg/L (ppm) in addition to control conditions of distilled water spray. Tween-20 (0.1%) was used as a surfactant for foliar spray. Solutions of Kinetin in respective concentrations were prepared in estimated (predetermined by trial method) amount of water by taking the great care of their half-life, temperature, and other environmental hazards which cause the denaturation of PGRs solution. Plants were exposed to Ist spray of PGRs after twenty days after germination repeated twice after every ten days with great care of avoiding falling of drops of solution from the leaf surface.
Data recordings
Chlorophyll (a, b ) and Carotenoids Contents (mg g-1 leaf F. wt)
Pigments contents after ten days of the last spray were measured by using the formula of Arnon [17]. The leaves were chopped into small pieces that were extracted with 80% acetone. The absorbance was measured at 645nm and 663nm for Chl a, b, and total chlorophyll respectively and at 480nm for carotenoids by using a spectrophotometer (Hitachi Model-U 2001 Japan). Then chlorophyll a, b and total chlorophyll were calculated according to the Lichtenthaler [18] formulae and carotenoids contents were calculated as:
Chl a (mg g-1 leaf fresh weight) = [12.7(OD663) - 2.69 (OD645)] × V/1000 ×W.
Chl b (mg g-1 leaf fresh weight) = [22.9(OD645) - 4.68(OD663)] × V/1000 ×W.
Carotenoids (mg g-1 leaf fresh weight) = [Acar/EM] × 1000.
Where
Acar = OD480+0.114(OD663)-0.638(OD645); EM (100%)=2500; OD =Optical density; V = Volume of sample; W = Weight of sample.
Leaf water potential [Yw; -MPa]
The third leaf from the top (fully expanded youngest leaf) was utilized for predawn leaf water potential (Ψw) measurements using a pressure chamber (ARIMAD 2-Japan) after ten days of Kinetin spray. Water potential Yw was measured between 11:00 AM and 01:00 PM because Fischer et al., [19] reported that Yw remains reasonably stable during this period.
Leaf osmotic potential [Ys; -MPa]
The same leaf, as used for water potential, was frozen in a freezer below -20oC for seven days after which time the frozen leaf material was thawed and cell sap was extracted with the help of a disposable syringe. The sap so extracted was directly used for the determination of osmotic potential using an osmometer.
Statistical analysis
The data collected were analyzed for analysis of variance for all the parameters using COSTAT computer package (CoHort Software, Berkeley, CA). Duncan's New Multiple Range test at a 5% level of probability was used to compare means [20]. Where significant F values were obtained in analysis, differences between individual means were tested by LSD tests at 0.05% significance level, by using MSTAT-C Computer Statistical Programme.
Results
Chlorophyll a Contents (mg g-1 leaf F. wt)
According to Duncan’s Multiple Range test (Table: 1), the index of variability in chlorophyll-a contents revealed a degree of significant induction for enhancing effects of Kinetin on its concentration. Chlorophyll a was affected significantly by all levels of Kinetin but this effect was the most pronounced (26.707%) when Kinetin solution of 150mg/L concentration was sprayed.
Table 1: Chlorophyll a Contents (mg g-1 leaf F. wt) of 50 days old Mash [Vigna mungo (L.) Hepper] exposed to three shoot system sprays of Kinetin concentrations (0, 25, 50, 75, 100, 125, and 150 mg/L) at 20 to 40 days of age [Values represent means ± SE]. Values in parentheses represent % age increase (+)/decrease (-) over untreated of row#1 or over MASH 80 for genotypes means. Values followed by dissimilar letters are different at P = 0.05 among means of treatments.
|
Kinetin (mg/L) |
MASH 80 |
MASH 88 |
MASH 97 |
MASH ES-1 |
TREATMENTS MEANS (LSD=0.040 ;n=16) |
|
(n=4) |
|||||
|
Distilled water |
0.848±0.073 |
0.793±0.35 |
0.8414±0.116 |
0.8±0.017 |
0.820 d ±0.068 |
|
25 |
0.877±0.055 (3.419) |
0.873±0.31 (10.088) |
0.847±0.038 (0.665) |
0.869±0.022 (8.625) |
0.867 c ±0.036 (5.732) |
|
50 |
0.841±0.016 (-0.825) |
0.95±0.063 (19.798) |
0.973±0.056 (15.640) |
0.875±0.040 (9.375) |
0.91 b ±0.70 (10.975) |
|
75 |
1.010±0.060 (19.103) |
0.998±0.059 (25.851) |
1.023±0.057 (21.583) |
1.030±0.126 (28.750) |
1.015 a ±0.074 (23.780) |
|
100 |
0.981±0.074 (15.683) |
1.069±0.051 (34.804) |
1.001±0.0663 (18.968) |
1.009±0.046 (26.125) |
1.015 a ±0.064 (23.780) |
|
125 |
1.065±0.068 (25.589) |
1.018±0.036 (28.373) |
1.030±0.066 (22.415) |
1.009±0.034 (26.125) |
1.030 a ±0.052 (25.609) |
|
150 |
1.057±0.037 (24.646) |
1.036±0.017 (30.643) |
1.032±0.008 (22.652) |
1.031±0.014 (28.875) |
1.039 a ±0.022 (26.707) |
|
GENOTYPES MEANS → |
0.954 ±0.105 |
0.962 ±0.10 (-0.838) |
0.964 ±0.098 (-1.048) |
0.946 ±0.102 (0.838) |
0.957±0.100 |
|
|
(LSD=0.030 ; n=28) |
|
|||
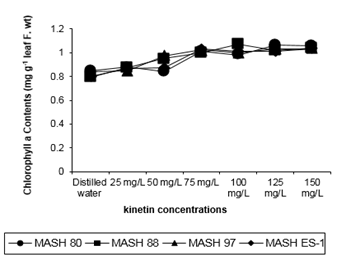
Figure 1: chlorophyll-a contents (mg g-1 leaf f. Wt) of 50 days old Mash [Vigna mungo (L.) Hepper] exposed to three shoot system sprays of Kinetin at 20 to 40 days of age
Three of all the experimental genotypes showed synchrony to this action pattern but MASH 80 set a sigmoidal pattern for Kinetin effect in which the effect of 125mg/L was the most pertinent in stimulating chlorophyll-a contents (Figure 1). A conflicting role of Kinetin to its general augmentation was observed when 50mg/L concentration rendered the plants of MASH 80 less productive of chlorophyll a by a value of 0.825% from untreated analogs. Of the genotypes, MASH 97 revealed maximum (0.964) and MASH ES-1 revealed minimum (0.946) but by statistical approach all genotypes were indistinguishable.
Chlorophyll b Contents (mg g-1 leaf F. wt)
Table 2: Chlorophyll b Contents (mg g-1 leaf F. wt) of 50 days old Mash [Vigna mungo (L.) Hepper] exposed to three shoot system sprays of Kinetin concentrations (0, 25, 50, 75, 100, 125, and 150 mg/L) at 20 to 40 days of age [Values represent means ± SE]. Values in parentheses represent % age increase (+)/decrease (-) over untreated of row#1 or over MASH 80 for genotypes means. Values followed by dissimilar letters are different at P = 0.05 among means of treatments.
|
Kinetin (mg/L) |
MASH 80 |
MASH 88 |
MASH 97 |
MASH ES-1 |
TREATMENTS MEANS (LSD=0.006 ;n=16) |
|
(n=4) |
|||||
|
Distilled water |
0.068±0.010 |
0.066±0.010 |
0.063±0.011 |
0.064±0.010 |
0.065 c ±0.0096 |
|
25 |
0.071±0.016 (4.411) |
0.068±0.016 (3.030) |
0.063±0.016 (0) |
0.068±0.016 (6.250) |
0.068 c ±0.015 (4.615) |
|
50 |
0.065±0.007 (-4.411) |
0.067±0.002 (1.515) |
0.075±0.005 (19.047) |
0.070±0.003 (9.375) |
0.070 c ±0.006 (7.692) |
|
75 |
0.073±0.012 (7.352) |
0.080±0.005 (21.212) |
0.082±0.004 (30.158) |
0.078±0.003 (21.875) |
0.078 b ±0.007 (20.000) |
|
100 |
0.083±0.008 (22.058) |
0.084±0.005 (27.278) |
0.088±0.007 (39.682) |
0.085±0.004 (32.812) |
0.085 ab ±0.006 (30.769) |
|
125 |
0.093±0.007 (36.764) |
0.092±0.008 (39.393) |
0.085±0.004 (34.920) |
0.088±0.008 (37.500) |
0.090 a ±0.007 (38.461) |
|
150 |
0.083±0.009 (22.058) |
0.081±0.009 (22.727) |
0.081±0.009 (28.571) |
0.083±0.010 (29.687) |
0.082 b ±0.008 (26.153) |
|
GENOTYPES MEANS → |
0.077 ±0.013 |
0.077 ±0.012 (0.000) |
0.077 ±0.012 (0.000) |
0.076 ±0.011 (1.298) |
0.077±0.012 |
|
|
(LSD=0.005 ; n=28) |
|
|||
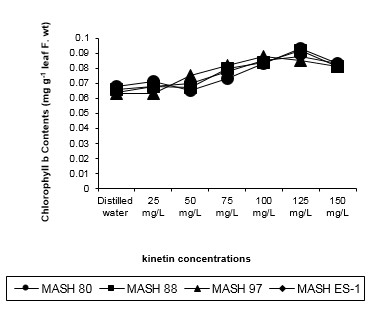
Figure 2: Chlorophyll b contents (mg g-1 leaf f. Wt) of 50 days old Mash [Vigna mungo (L.) Hepper] exposed to three shoot system sprays of Kinetin at 20 to 40 days of age.
Duncan’s Multiple Range test (Table: 2) revealed that Kinetin established stimulation in chlorophyll b contents of plants. A remarkable and statistically significant effect of Kinetin was achieved when applied in a concentration range of Application of 75 to 150mg/L. Lower concentrations did not show an appreciable rise in chlorophyll b contents. The predominant significant values were recorded by the application of 125mg/L Kinetin rather than 100mg/L thereby exhibiting a sigmoidal action pattern (Figure 2). All the genotypes responded similarly to the extremity of response except MASH 97 for which the same was true by 100mg/L concentration. Kinetin when applied at 50mg/L concentration on MASH 80, exerted negative influence giving mean value 4.411% less than that of control providing an opposite index of Kinetin action. Of the 4 genotypes, three revealed equal (0.077) while MASH ES-1revealed minimum (0.076) but by statistically all genotypes were similar.
Total Carotenoids Contents (mg g-1 leaf F. wt)
Kinetin concentrations differed statistically as revealed by mean values after Duncan’s Multiple Range test (Table: 4). Kinetin induced a rise in carotenoids contents and this induction in rising corresponded to the applied concentration of Kinetin.
Table 3: Total Carotenoids Contents (mg g-1 leaf F. wt) of 50 days old Mash [Vigna mungo (L.) Hepper] exposed to three shoot system sprays of Kinetin concentrations (0, 25, 50, 75, 100, 125, and 150 mg/L) at 20 to 40 days of age [Values represent means ± SE]. Values in parentheses represent % age increase (+)/decrease (-) over untreated of row#1 or over MASH 80 for genotypes means. Values followed by dissimilar letters are different at P = 0.05 among means of treatments.
|
Kinetin (mg/L) |
MASH 80 |
MASH 88 |
MASH 97 |
MASH ES-1 |
TREATMENTS MEANS (LSD=0.007 ;n=16) |
|
(n=4) |
|||||
|
Distilled water |
0.045±0.009 |
0.044±0.011 |
0.043±0.012 |
0.045±0.011 |
0.044 d ±0.010 |
|
25 |
0.051±0.014 (13.333) |
0.048±0.016 (9.090) |
0.048±0.018 (11.627) |
0.050±0.018 (11.111) |
0.049 cd ±0.015 (11.363) |
|
50 |
0.064±0.004 (42.222) |
0.057±0.006 (29.545) |
0.051±0.010 (18.604) |
0.052±0.010 (15.556) |
0.056 bc ±0.009 (27.272) |
|
75 |
0.062±0.002 (37.778) |
0.056±0.014 (27.272) |
0.052±0.01 (20.930) |
0.057±0.004 (26.667) |
0.057 bc ±0.009 (29.545) |
|
100 |
0.075±0.009 (66.667) |
0.071±0.007 (61.363) |
0.077±0.006 (79.069) |
0.065±0.003 (44.444) |
0.072 a ±0.008 (63.636) |
|
125 |
0.061±0.004 (35.556) |
0.069±0.009 (56.818) |
0.068±0.008 (58.139) |
0.058±0.014 (28.889) |
0.064 b ±0.009 (45.454) |
|
150 |
0.066±0.011 (46.667) |
0.064±0.11 (45.454) |
0.065±0.011 (51.162) |
0.055±0.011 (22.222) |
0.062 b ±0.011 (40.909) |
|
GENOTYPES MEANS → |
0.060 ±.0.012 |
0.059 ±0.013 (1.667) |
0.058 ±0.015 (3.333) |
0.055 ±0.012 (8.333) |
0.058±0.013 |
|
|
(LSD=0.005 ; n=28) |
|
|||
A statistically conceivable proportion in carotenoids increase was achieved by concentration ranging from 25 to 150mg/L. The increase at the most (63.636%) appeared to occur when measured under the influence of 100mg/L concentration.
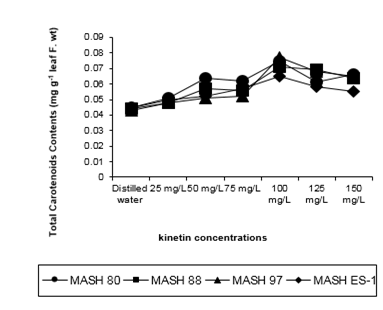
Figure 3: Total carotenoids contents (mg g-1 leaf f. Wt) of 50 days old Mash [Vigna mungo (L.) Hepper] exposed to three shoot system sprays of Kinetin at 20 to 40 days of age
A higher dose application caused a marked derangement of the logically expected pattern of Kinetin action revealing the sigmoidal expression curve (Figure 3). A similar action of Kinetin in enhancing carotenoids was noted in all the genotypes. MASH 80 revealed maximum (0.060) and MASH ES-1 revealed minimum (0.055) values but by statistical approach, genotypes could not be discriminated.
Leaf Water Potential [Yw; -MPa]
According to Duncan’s Multiple Range test, Kinetin provided a significant role in regulating plant response in terms of water potential when applied in the concentration range of and over 100mg/L (Table: 5). The expression of water potential values supported the manipulation, although to a different degree, by exogenous Kinetin application. The maximum effect in MASH ES-1 was by 50mg/L, in MASH 97 and MASH 80 by 100mg/L, and in MASH 88 by 125mg/L. This showed that whatever the genotype if considered, a response at the most was not by the highest level of Kinetin concentration. This revealed again a sigmoidal action pattern (Figure 4). Water potential, when measured under lower concentrations, revealed an upset of irregular and insignificant reduction from control plants. Among the genotypes, MASH 97 revealed maximum (0.863) and MASH ES-1 revealed minimum (0.782) values.
Leaf Osmotic Potential [ Ys; -MPa]
Although increasing amount of Kinetin appeared to be responsible for the gradual increase in osmotic potential but could not provide precise information about the action pattern of Kinetin under some concentrations (Table: 6). Generally, the maximum (8.93%) effect was by 150mg/L and minimum (2.306%) by 50mg/L.
Table 4: Leaf water potential [Yw; -MPa] of 50 days old Mash [Vigna mungo (L.) Hepper] exposed to three shoot system sprays of Kinetin concentrations (0, 25, 50, 75, 100, 125, and 150 mg/L) at 20 to 40 days of age [Values represent means ± SE]. Values in parentheses represent % age increase (+)/decrease (-) over untreated of row#1 or over MASH 80 for genotypes means. Values followed by dissimilar letters are different at P = 0.05 among means of treatments and genotypes (lower case letters) as well as among interactions (upper case letters).
|
Kinetin (mg/L) |
MASH 80 |
MASH 88 |
MASH 97 |
MASH ES-1 |
TREATMENTS MEANS (LSD=0.068 ;n=16) |
|
(LSD=0.133 ;n=4) |
|||||
|
Distilled water |
0.729±0.106 [FGHI] |
0.814±0.056 [DEFG] |
0.822±0.216 [CDEFG] |
0.661±0.128 [I] |
0.757 c ±0.142 |
|
25 |
0.703±0.036 (-3.566) [GHI] |
0.768±0.109 (-5.651) [EFGHI] |
0.864±0.129 (5.109) [BCDEF] |
0.673±0.091 (1.815) [HI] |
0.752 c ±0.115 (0.660) |
|
50
|
0.881±0.061 (20.850) [BCDE] |
0.779±0.016 (-4.299) [DEFGHI] |
0.808±0.036 (-1.703) [DEFG] |
0.737±0.032 (11.497) [FGHI] |
0.801 bc ±0.064 (5.812) |
|
75
|
0.726±0.110 (-0.411) [FGHI] |
0.951±0.114 (16.830) [ABC] |
0.861±0.093 (4.744) [BCDEF] |
0.669±0.082 (1.210) [HI] |
0.802 bc ±.145 (5. 0944) |
|
100 |
0.834±0.057 (14.403) [BCDEFG] |
1.050±0.060 (28.992) [A] |
0.962±0.156 (17.031) [AB] |
0.880±0.090 (33.131) [BCDE] |
0.931 a ±0.123 (22.985) |
|
125
|
0.777±0.157 (6.584) [DEFGHI] |
0.888±0.115 (9.090) [BCDE] |
0.878±0.105 (6.812) [BCDE] |
1.084±0.099 (63.993) [A] |
0.907 a ±0.158 (19.815) |
|
150
|
0.825±0.040 (13.168) [BCDEFG] |
0.793±0.046 (-2.579) [DEFGHI] |
0.804±0.012 (2.189) [DEFGH] |
0.910±0.012 (37.670) [BCD] |
0.833 b ±0.055 (10.040) |
|
GENOTYPES MEANS → |
0.782 b ±0.10 |
0.863 a ±0.123 (-0.103) |
0.857a ±0.121 (-9.590) |
0.802 b ±0.169 (-2.557) |
0.826±0.134 |
|
|
(LSD=0.051 ; n=28) |
|
|||
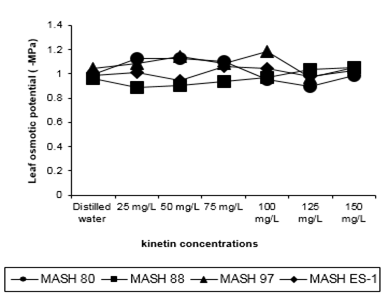
Figure 4: Leaf water potential of 50 days old Mash [Vigna mungo (L.) Hepper] exposed to three shoot system sprays of Kinetin at 20 to 40 days of age
Table 5: Leaf osmotic potential [Ys; -MPa] of 50 days old Mash [Vigna mungo (L.) Hepper] exposed to three shoot system sprays of Kinetin concentrations (0, 25, 50, 75, 100, 125, and 150 mg/L) at 20 to 40 days of age [Values represent means ± SE]. Values in parentheses represent % age increase (+)/decrease (-) over untreated of row#1 or over MASH 80 for genotypes means. Values followed by dissimilar letters are different at P = 0.05 among means of treatments and genotypes (lower case letters) as well as among interactions (upper case letters).
|
Kinetin (mg/L) |
MASH 80 |
MASH 88 |
MASH 97 |
MASH ES-1 |
TREATMENTS MEANS (LSD=0.087 ;n=16) |
|
|
(LSD=0.172 ;n=4) |
||||||
|
Distilled water |
0.999±0.007 [DEFGH] |
0.963±0.049 [EFGH] |
1.042±0.055 [CDEFGH] |
0.983±0.067 [DEFGH] |
0.997 a ±0.054 |
|
|
25 |
1.128±0.133 (12.912) [CDE] |
0.890±0.092 (-7.580) [H] |
1.083±0.109 (3.934) [CDEFG] |
1.01±0.036 (2.746) [CDEFGH] |
1.028 a ±0.128 (3.109) |
|
|
50 |
1.124±0.064 (12.512) [CDEF] |
0.904±0.064 (-6.126) [H] |
1.143±0.046 (9.692) [CD] |
0.945±0.028 (-3.865) [FGH] |
1.02 a ±0.119 (2.306) |
|
|
75 |
1.105±0.028 (10.610) [CDEFG] |
0.936±0.059 (-2.803) [CDEFGH] |
1.087±0.147 (4.318) [CDEFG] |
1.061±0.125 (7.934) [CDEFGH] |
1.047 a ±0.114 (5.015) |
|
|
100 |
0.956±0.487 (-4.304) [EFGH] |
0.972±0.138 (0.934) [DEFGH] |
1.182±0.203 (13.435) [C] |
1.047±0.052 (6.510) [CDEFGH] |
1.039 a ±0.262 (4.212) |
|
|
125 |
0.898±0.054 (-10.110) [H] |
1.035±0.005 (7.476) [B] |
0.970±0.034 (-6.909) [DEFGH] |
0.977±0.039 (-0.610) [DEFGH] |
1.051 a ±0.188 (5.416) |
|
|
150 |
0.990±0.049 (-0.900) [DEFGH] |
1.049±0.137 (8.930) [A] |
1.054±0.059 (1.151) [CDEFGH] |
1.028±0.029 (4.577) [CDEFGH] |
1.066 a ±0.105 (6.920) |
|
|
GENOTYPES MEANS → |
1.028 ab ±0.192 (-2.085) |
1.030ab±0.183 (-2.284) |
1.080 a ±0.116 (-7.249) |
1.007b ±0.067 |
1.037±0.149 |
|
|
|
(LSD=0.066 ; n=28) |
|
||||

Figure 5: Leaf osmotic potential of 50 days old Mash [Vigna mungo (L.) Hepper] exposed to three shoot system sprays of Kinetin at 20 to 40 days of age
This revealed that Kinetin stimulated the percentage of increase in osmotic potential. Responses of genotypes to different concentrations imply that the application of Kinetin amplified the plant responses but with different and random degrees as some of the observations were excluded from the ongoing trend (Figure 5). The osmotic potential was also sometimes inhibited, although irregularly, concerning genotypes and concentrations of Kinetin. MASH 88 revealed maximum (1.049) and MASH 80 revealed minimum (1.007) osmotic potential and both differed significantly. Other genotypes were between these two.
Discussion
In this experiment, Kinetin application increased the chlorophyll a and b contents. Chlorophyll contents increased according to escalating levels of Kinetin. Kinetin may have two ways for induction of stimulatory effects on chlorophylls i.e., the enhancement of chlorophyll synthesis contents and control of its degradation [12, 21-23]. In addition, Emongor and Tshwenyane [22] also reported that cytokinins, increase chlorophyll development, and chlorophyll synthase. Control over senescence might be the reason for increased chlorophyll contents by Kinetin [24].
In this experiment, Kinetin application increased the carotenoid contents according to levels of Kinetin. Change in carotenoids contents might be due to a change in its rate of synthesis. Little is known about the mechanisms of the enzymes involved in carotenoids biosynthesis in plants. However, the biosynthetic precursor proteins after the translational process are imported into plastids where carotenoids biosynthesis occurs. Carotenoid biosynthesis might be regulated at the transcriptional level by external factors [25]. Kinetin has been reported to stabilize the transcription and to control the accumulation of RNA. This might be a reason for carotenoids stability [26]. Carotenoids degradation might be prevented by thylakoid membrane stability as Gadallah [27] found that the application of plant growth regulator increased the stability of membranes. In the present study Kinetin induced an increase of plant water potential. Kinetin application may increase water uptake by increasing photosynthetic product thereby improving osmotic potential. Kinetin mediated photosynthesis is reported by klamkowski et al. [28]. High osmotic potential might be also due to higher concentration of minerals in the above-ground parts due to more uptake of minerals by lengthening of the root hair zone [29-31], stimulation of cambium activity leading to forming of phloem [32-35]. The experimental results revealed an increase in osmotic potential due to Kinetin. Kinetin stimulates the osmotic adjustment.
Sigmoidal pattern
The results expressed here, revealed a sigmoidal pattern of Kinetin action (Figure 1-5). This might be attributed to the fact that usually, all known plant hormones display a very broad and complex action spectrum. In some experiments, their effects are clear directly after a short time while in others it takes hours. It has been tried to conclude about their mode of action from activities of enzymes or membrane properties. The effect of a plant growth regulator depends on the application rate and the developmental stage of the plant at the time of application [4]. This might be a reason for unexpected results. Another possibility exists in the fact that cytokinins may not always be active in the absence of other hormones [11]. Often the response of a plant is governed by the interaction of two or more hormones [36,37]. The ratio of cytokinin to auxin determines the differentiation of organs as high cytokinin favors shoots, while high auxin ratio favors roots. The ratio also determines the signaling pathways for cytokinin action [38]. The sensitivity of cells is also another factor for dose-dependent action [15]. A characteristic feature differentiating various hormones is that they regulate functions in deferentparts of a plant[39]. Exogenous Cytokinin at higher concentration stimulates the biosynthesis of ethylene in tissues [36,37]. Ethylene mediated role may be involved in nullifying cytokinin action at higher concentrations. The variation in response to a given concentration, optimal dosage variation, and dose-response curves determination is attributed to the limited availability of cell-specific receptors [40].
Conclusions
The results of the present study indicated that Kinetin treatments increased yield. The obtained data indicated that the use of Kinetin @ 100 mM concentration might be a useful practice for pigments and enzyme production in the Mash. As such effects have been seen; the important question is whether they can be translated successfully to farmer’s fields. This should be evaluated with different genotypes.
Conflict of interest: The authors have no conflict of interest.
References