Pharmacophore an International Research Journal
Biomarkers of Myocardial Fibrosis and Renal Dysfunction in Hypertensive Patients with Type 2 Diabetes Mellitus
Oleksandr M Bilovol1, Iryna I. Kniazkova2, Oleksandr M. Kirienko3, Maryna V Bogun4, Denis M. Kirienko5, Lilya P. Abramova6, Alexander E Berezin7*
|
|
|
ABSTRACT
The aim of the study was to investigate the interaction of circulating levels of sST2, neutrophilic gelatinase-associated lipocalin, and cystatin C with cardiac remodeling in hypertensive patients depending on the presence of T2DM. Methods: The study included 76 mild-to-moderate hypertensive patients, of whom 48 patients were with stage II grade 2 of hypertension and T2DM, and 28 patients with stage II of hypertension without T2DM. The control group consisted of 20 healthy volunteers (mean age of 54.5 ± 3.1 years). All examined persons underwent general clinical examination, determination of indicators of carbohydrate metabolism and lipid profile; insulin resistance was assessed using the HOMA-IR index. Serum levels of soluble suppressor tumorigenicity-2 (sST2), cystatin C, and NGAL were measured using kits for enzyme-linked immunosorbent assay. The structural and functional parameters of the heart and the diastolic function of the left ventricle were analyzed using echocardiography with Doppler sonography. Results: It was found that concentric and eccentric LV hypertrophy, and diastolic dysfunction, occurred more often in hypertensive patients with T2DM than in the hypertensive patients without T2DM. In T2DM patients eccentric and concentric LV remodeling was associated with the levels of sST2 (r = 0.53; P=0.001 and r = 0.55; P=0.001, respectively), cystatin C (r = 0.40; P=0.001 and r = 0.44; P=0.001, respectively) and NGAL (r = 0.38; P=0.001 and r = 0.44; P=0.001, respectively). Backward stepwise regression analyses showed that the most influential determinants of depending variable (LV remodeling) in T2DM patients were sST2 (B-coefficient = 1.9, SD = 0.03; p=0.001) and cystatin C (B-coefficient = 0.92, SD = 0.03; p=0.022), whereas NGAL exhibited weak discriminative ability (B-coefficient = 0.21, SD = 0.01; p=0.16). Conclusion: Cardiac remodeling in hypertensive patients having T2DM was significantly associated with higher levels of sST2 and cystatin C. sST2 had the best potency to predict LV remodeling when compared with NGAL and other biomarkers.
Keywords: hypertension, type 2 diabetes mellitus, soluble suppressor tumorigenicity-2, neutrophilic gelatinase-associated lipocalin, diastolic function, diastolic function
Introduction
Arterial hypertension (AH) is a disease that occurs when there is a change in cardiac output, regional vascular resistance, or both resulting in a constant increase in blood pressure of the arteries of individuals [1]. Diabetes mellitus is a common endocrine disorder caused by the reduction of insulin production through the pancreas, which results in an increase in glucose concentrations in the blood [2]. One of the important medical and social problems of our time is the burden of comorbidity including a combination of arterial hypertension and type 2 diabetes mellitus (T2DM), which causes an increase in the risk of premature mortality [3]. Hemodynamic disorders together with metabolic disorders in patients with AH and T2DM lead to damage in target organs and early development of cardiovascular (CV) complications with both macro-angiopathy and micro-angiopathy [4]. It is known that unfavorable changes in the heart and kidneys, in turn, significantly worsen the prognosis of patients with AH and T2DM increasing the risk of CV complications [5]. Therefore, the study of target organ damage in patients having both AH and type 2 DM is important for improvement in the prognosis and point-of-care strategy of the patients [6].
Adverse cardiac remodeling in hypertension is caused by a complex interaction between genetic, neurohormonal, and inflammatory changes affecting cardiac myocytes and extracellular matrix [7-9]. In this regard, the increasing clinical significance is assigned to the biomarkers of myocardial stress, dysfunction, and cellular damage [10]. Among the biomarkers of myocardial fibrosis, soluble suppressor of tumorigenicity-2 (sST2) is actively studied and exhibits conflicting results in the prediction of poor prognosis in patients having T2DM [11]. However, there is no strong agreement on the prognostic value of modern indicators of renal damage and cystatin C dysfunction, and neutrophilic gelatinase-associated lipocalin (NGAL) [12, 13]. The study of the relationship of these biomarkers with clinical, instrumental, and other biochemical parameters in hypertension in combination with T2DM seems to be a promising direction in the management strategy of this cohort of patients.
The aim of the study was to investigate the interaction of circulating levels of sST2, neutrophilic gelatinase-associated lipocalin, and cystatin C with cardiac remodeling in hypertensive patients depending on the presence of T2DM.
Methods
The single-center cross-sectional study included 76 hypertensive patients, 48 patients (29 males and 19 females, mean age of 54.3 ± 3.2 years) had T2DM, and 28 patients (18 males and 10 females, mean age of 54.8 ± 3.5 years) did not have T2DM. All patients were examined in accordance with the recommendations of the European Society of Hypertension and the European Society of Cardiology (ESH/ESC, 2018) [14, 15] and the American Diabetes Association (ADA, 2017) [16].
The exclusion criteria were the following: stage III, grade 3 of hypertension, history of exertional angina, history of myocardial infarction and transient ischemic attack/stroke, III/IV NYHA functional class of chronic heart failure, valvular heart disease, connective tissue diseases, malignancy, thyroid dysfunction, type 1 DM, patients undergoing insulin therapy; reduced glomerular filtration rate < 60 mL/min; and left ventricular ejection fraction <50%.
All patients underwent antihypertensive therapy (a combination of generally accepted drug classes: ACE inhibitors, calcium channel antagonists, beta-blocker [carvedilol] in optimal therapeutic doses). All patients received rosuvastatin at a dose of 20 mg and acetylsalicylic acid at a daily dose of 75 mg. A combination of metformin and gliclazide was prescribed to improve hyperglycemia. The control group consisted of 20 healthy individuals (mean age of 54.5 ± 3.1 years).
Ethical declaration
Informed consent was obtained from all patients for participation in the study.
General anthropometric, clinical, and physical examinations
Conventional anthropometric measurements (height, weight, waist circumference, hip-to-waist ratio, body mass index [BMI]) were performed. Clinical history was recorded and specified. All patients underwent general clinical and physical examination, office blood pressure (BP) and heart rate (HR) measure, as well as ambulatory BP monitoring at baseline.
Echocardiography
Echocardiography was carried out on the State Institution "National Institute of Therapy named after L. T. Malaya of NAMS of Ukraine". We used ultrasound machine "GE Medical Systems" (Germany) by a phase sensor with a modulated frequency of 2.25-3 MHz in M- and B-modes in accordance with the recommendations of the American Society of Echocardiography (2015) [17]. LV myocardial mass (LVMM) was calculated and the LVMM index (LVMMI) was determined as the ratio of LVMM to body surface area. The types of LV remodeling (eccentric LVH, concentric LVH, concentric remodeling) were determined in accordance with the ASE guidelines (2015) [17].
The analysis of LV diastolic function was carried out during the registration of the transmitral diastolic flow in the pulse-wave Doppler mode [18]. The maximum rate of late filling of the LV in tissue mode (A), the maximum rate of late filling of the LV in tissue mode (a), the maximum rate of the early atrial filling (E), the maximum rate of early filling of the LV in tissue mode (e), the ratio of the rates of early and late fillings (E/A), the ratio of the maximum rates of early and late LV fillings in the tissue mode (e/a), the time of deceleration of the rate of early diastolic flow (DT), isovolumic relaxation time (IVRT) were also determined.
Glomerular filtration rate measurement
Calculation of glomerular filtration rate (GFR) was calculated by CKD-EPI formula [19]
Insulin resistance determination
Insulin resistance was calculated as Homeostatic Assessment Model of Insulin Resistance (HOMA-IR) using the appropriate equation [20]:
HOMA-IR= fasting insulin (mU/L) × fasting glucose (mmol/L)/22.5
Biomarkers measurement
Blood samples were drawn in the morning following overnight fasting (at 7-8 a.m.) into barcoded silicone test tubes. Then samples were centrifuged upon permanent cooling at 6,000 rpm for 3 minutes and then plasma was collected to be immediately refrigerated. Each aliquot was stored at -70оС.
Fasting blood serum glucose, glycosylated hemoglobin (HbA1c) levels in whole blood, insulin, and lipid profile parameters were determined using commercial kits manufactured by DRG (USA) using Labline-90 analyzer (Austria)
The concentration of sST2 ("Critical Diagnostics", USA), cystatin C (Bio Vendor, Czech Republic), and NGAL ("Hycult Biotech", Netherlands) were measured in serum with commercial kits for enzyme-linked immunosorbent assay.
Statistics
Computer processing of the study results was made using the Statistica 8.0 software package (StatSoft Inc, USA). The mean (M), variance, standard deviation, median (m), significance, and significance level (p) were calculated. For assessment of the relationship between the indicators, the method of correlation analysis was used with the calculation of Pearson's correlation coefficients (with a normal distribution) and Spearman’s correlation coefficients (with a distribution that differs from normal). Backward stepwise multiple regression analysis was performed to establish the most significant determinants of LV remodeling entering the following variables: age, sex, waist circumference, WHR, BMI, CV risk factors, HOMA-IR, and biomarkers (sST2, NGAL, cystatin C). Differences were considered significant at the level of statistical significance p <0.05.
Results
Basic demographic, clinical, and anthropometric characteristics of the patient study population are reported in Table 1. There were no significant differences between both populations of hypertensive patients with and without T2DM.
Тable 1: Basic demographic, clinical and anthropometric characteristics of patient study population
|
Variables |
Healthy volunteers (n=20) |
Entire patient cohort (n=76) |
Hypertensive patients (n=76) |
P-value |
|
|
T2DM patients (n=48) |
Non-T2DM patients (n=28) |
||||
|
Age, year |
54.5 (50-57) |
54.5 (50-58) |
54,3 (51-57) |
54.8 (50-58) |
NS |
|
Male, n (%) |
12 (60) |
47 (61.8) |
29 (60.4) |
18 (64.3) |
NS |
|
Dyslipidemia, n (%) |
- |
73 (96.1)# |
47 (97.9) |
26 (96.4) |
NS |
|
Smoking, n (%) |
9 (45) |
35 (46.1) |
22 (45.8) |
13 (46.4) |
NS |
|
Abdominal obesity, n (%) |
- |
30 (39.5)# |
19 (39.6) |
11 (39.3) |
NS |
|
Microalbuminuria, n (%) |
- |
22 (28.9)# |
14 (29.2) |
8 (28.6) |
NS |
|
LV hypertrophy, n (%) |
- |
55 (72.4)# |
40 (83.3) |
15 (53.6) |
0.001 |
|
BMI, kg/m2 |
22.13 ± 0.35 |
25.26 ± 2.47# |
25.63 ± 2.45 |
24.91 ± 2.56 |
NS |
|
Waist circumference, sm |
78.9±2.73 |
83.0±3.61 |
84.1±3.67 |
82.3±3.58 |
NS |
|
WHR, units |
0.78±0.02 |
0.85±0.04 |
0.86±0.05 |
0.84±0.04 |
NS |
Notes: data are given as mean ± SD and median, # - significant difference between healthy volunteers and entire patient’ cohort (P1-2<0.05).
Abbreviations: WHR, Waist-to-hip ratio; BMI, body mass index; NS, not significant; SD, standard deviation.
Analysis of echocardiographic data showed that the most pronounced disorders of the structural and functional state of the myocardium were found in hypertensive patients with T2DM. LV hypertrophy was detected in 40 (83.3% of patients with T2DM and in 15 (53.56%) patients without T2DM (Table 2). Moreover, in patients with T2DM, unfavorable types of myocardial remodeling - concentric and eccentric LV hypertrophy (in 64.58% and 18.75%, respectively) were revealed, whereas in patients without type 2 DM, concentric remodeling and concentric LV hypertrophy prevailed (in 17.85% and 35.71%, respectively).
Table 2: Hemodynamics and biomarkers in patient study population
|
Variables |
Healthy volunteers (n=20) |
Entire patient cohort (n=76) |
Hypertensive patients (n=76) |
P-value |
|
|
T2DM patients (n=48) |
Non-T2DM patients (n=28) |
||||
|
Office SBP, mm Hg |
124 ± 4 |
135 ± 5 |
134 ± 5 |
136 ± 6 |
NS |
|
Office DBP, mm Hg |
76 ± 5 |
79 ± 5 |
80 ± 4 |
78 ± 5 |
NS |
|
LVEDV, mL |
93 ± 2 |
113 ± 3# |
117 ±4 |
108 ± 3 |
NS |
|
LVESV, mL |
30 ± 2 |
42 ± 2# |
43 ± 3 |
39 ± 3 |
0.05 |
|
LVEF, % |
64 ± 3 |
62 ± 1# |
62 ± 3 |
62 ± 3 |
NS |
|
LVMMI, g/m2 |
82.3 ± 0.07 |
133.45 ± 1.93# |
141.35 ± 2.01 |
123.56 ± 1,83 |
0.05 |
|
E/e` |
5.31 ± 0.08 |
6.01 ± 0.12# |
6.30 ± 0.15 |
5.73 ± 0.13 |
0.05 |
|
GFR, mL/min/1.73 m2 |
102± 7.63 |
93± 5.63 |
87± 5.78 |
95± 5.59 |
NS |
|
HOMA-IR |
1.66±0.58 |
5.31 ±2.87# |
5.63 ±3.48 |
4.49 ±2.51 |
NS |
|
Fasting glucose, mmol/L |
4.27±1.35 |
5.73±1.54# |
6.14±1.76 |
5.43±1.32 |
NS |
|
HbA1c, % |
4.38 ± 1.51 |
6.17 ± 1.37# |
6.59 ± 1.59 |
5,58 ± 1.39 |
NS |
|
TC, mmol/L |
5.2±1.13 |
6.23 ± 1.13# |
6.35±1.17 |
5.91±1.15 |
0.05 |
|
HDL-C, mmol/L |
1.3 ±0.12 |
1.00 ± 0.12# |
0.93±0.15 |
1.08±0.09 |
NS |
|
LDL-C, mmol/L |
3.05 ±0.05 |
4.31 ± 0.07# |
5.03±0.06 |
3.95 ±0.08 |
0.045 |
|
TG, mmol/L |
1.7 ±0.05 |
2.23 ± 0.04# |
2.28±0.09 |
2.05 ±0.08 |
NS |
|
sST2, ng/mL |
19.1 (16.19-26.12) |
31.29 (24.32 – 42.35)# |
35.29 (31.33 – 42.35) |
27.15 (24.32 – 33.18) |
0.001 |
|
NGAL, ng/mL |
9.73 (6.83 – 14.12) |
15.19 (12.0 - 20.19) # |
17.12 (13.15 – 20.19) |
14.26 (12.0 – 17.25) |
0.058 |
|
Cystatin C, ng/mL |
82.0 (68.79 – 108.12) |
193.0 (101.40-302.10)# |
269.0 (179.01- 328.13) |
106.0 (98.93 – 270.12) |
0.001 |
Notes: data are given as mean ± SD and median, # - significant difference between healthy volunteers and entire patient’ cohort (P1-2<0.05).
Abbreviations: SBP – systolic blood pressure; DBP – systolic blood pressure; HbAc1, glycosylated hemoglobin; GFR, glomerular filtration rate, TC, total cholesterol; LDL, low-density lipoproteins; HDL, high-density lipoproteins; TG, triglycerides.
Hypertensive patients with T2DM had the highest LV myocardial mass index (LVMI), end-diastolic and end-systolic LV dimensions (EDD and ESD, respectively), end-diastolic and end-systolic LV volumes (EDV and ESV, respectively) in comparison with the group of patients with AH. The mean values of LVMM index in patients having T2DM were significantly higher than in patients without T2DM and the control group (p <0.05). The differences in all presented echocardiographic parameters were statistically significant between hypertensive patients with and without T2DM.
LV diastolic filling abnormalities were also found in hypertensive patients with T2DM and without it. However, both early (E) and late (A) diastolic filling velocities were more significantly reduced in T2DM patients than non-T2DM individuals and healthy volunteers. However, 16.7% of patients with T2DM and 35.7% of patients without T2DM did not have diastolic filling abnormalities.
In 52 (68.4%) patients who took part in the study, a slight decrease of renal function was diagnosed (GFR = 60-89 ml/min/1.73 m2). Normal renal function (GFR ≥90 ml/min/1.73 m2) was determined in 24 (31.6%) patients. Pairwise comparison of the groups revealed a statistically significant predominance of the reduced renal function in the group of patients with T2DM in comparison to those without it (p <0.001). The lowest estimated GFR was found in patients of group 1 in comparison with the patients of group 2 (p <0.01).
A comparative analysis of the levels of sST2, NGAL, and cystatin C in patient study populations is reported in Figure 1. In fact, the levels of sST2, NGAL, and cystatin C were significantly higher in T2DM patients when compared with non-T2DM individuals and healthy volunteers.
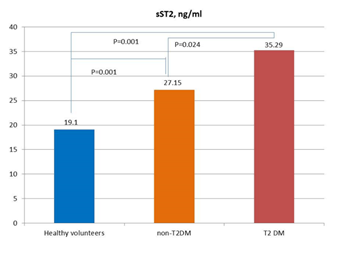
Figure 1A
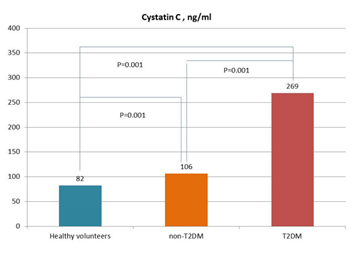
Figure 1B
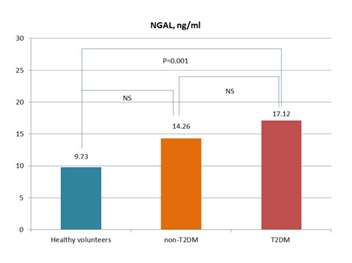
Figure 1C
Figure 1: Circulating levels of biomarkers in patients with and without T2DM in comparison with healthy volunteers. Figure 1A: sST2; Figure 1B: Cystatin C; Figure 1C: NGAL
Abbreviations: NS, not significant. The lines indicate comparisons between variables.
The concentrations of the biomarkers (sST2, NGAL, and cystatin C) in patients with T2DM did not differ significantly according to gender, overweight, or obesity (for all p= 0.46).
Correlations between HOMA-IR, anthropometric parameters, age, LV hypertrophy, diastolic filling abnormality, and biomarkers
In entire T2DM population, HOMA-IR was significantly and positively correlated with serum TG (r=0.48; p=0.002), WHR (r=0.50; p=0.001), waist circumference (r=0.48; p=0.001), LH hypertrophy (r=0.46; p=0.001), sST2 (r=0.44; p=0.042), BMI (r=0.42; p=0.002), age (r=0.44; p=0.012), diastolic filling abnormality (r=0.42; p=0.026), microalbumiuria (r =0.32; P=0.002), and smoking (r =0.24; P=0.001), while inverse correlation of HOMA-IR with HDL-C (r=-0.40; p=0.02) was observed.
Serum levels of NGAL and cystatin C were positively correlated with microalbumiuria (r =0.52; P=0.001 and r =0.54; P=0.002, respectively), WHR (r=0.44; p=0.001 and r =0.43; P=0.043, respectively), waist circumference (r=0.42; p=0.022 and r =0.44; P=0.022, respectively), LH hypertrophy (r=0.42; p=0.026 and r =0.42; P=0.016, respectively).
Correlations between eccentric and concentric forms of LV hypertrophy and biomarkers’ levels
We found positive correlation between eccentric and concentric LV remodeling and levels of sST2 (r = 0.50; P=0.042 and r = 0.54; P=0.001, respectively), WHR (r = 0.42; P=0.022 and r = 0.44; P=0.001, respectively). The levels of cystatin C (r = 0.28; P=0.042) and NGAL (r = 0.26; P=0.022) exhibited weak association with concentric LV remodeling in entire hypertensive patient population and did not correlated with eccentric LV remodeling.
Correlations between eccentric and concentric forms of LV hypertrophy and biomarkers’ levels in T2DM subpopulation
In T2DM patients eccentric and concentric LV remodeling was associated with the levels of sST2 (r = 0.53; P=0.001 and r = 0.55; P=0.001, respectively), cystatin C (r = 0.40; P=0.001 and r = 0.44; P=0.001, respectively) and NGAL (r = 0.38; P=0.001 and r = 0.44; P=0.001, respectively).
Backward Wald binary logistic regression analysis on factors associated with LV remodeling in T2DM patients
Backward stepwise regression analyses showed that the most influential determinants of depending variable (LV remodeling) in T2DM patients were sST2 (B-coefficient = 1.9, SD = 0.03; p=0.001) and cystatin C (B-coefficient = 0.92, SD = 0.03; p=0.022), whereas NGAL exhibited weak discriminative ability (B-coefficient = 0.21, SD = 0.01; p=0.16). Other variables, such as WHR, BMI, a number of CV risk factors, HOMA-IR, had insufficient predictive potency in both unadjusted ad adjusted for BMI regression models.
Discussion
The results of our study showed that the levels of sST2 and NGAL were significantly higher in patients with T2DM with mild renal dysfunction, whereas, there were no significant differences in the levels of cystatin C in both subpopulations of the patients. Nevertheless, eccentric and concentric LV remodeling was closely associated with the levels of sST2, cystatin C, and NGAL in patients having T2DM only.
We suggest that these biomarkers can be promising predictors for LV remodeling in hypertensive patients having T2DM and that sST2 is a potential target for therapy among these individuals. Recently other investigators gave their comments regarding use in routine clinical practice biomarkers of fibrosis (sST2) and kidney function (cystatin C and NGAL) to predict the natural evolution of both cardiac dysfunction and kidney dysfunction [21-24]. In this context, sST2 appeared to be better than others because it independently predicted CV events and diseases from early stages of chronic kidney disease to the late stage of one [25, 26]. However, there are conflicting results reflecting serious difficulties to extrapolate the predictive ability of these biomarkers to T2DM patients at different stages of chronic kidney disease [24]. Such biomarkers as NGAL, cystatin C, and KIM-1 were found to be powerful predictors for declining kidney function renal events and CV complications in patients with moderate and severe chronic kidney disease [27-30]. We firstly obtained data that clarify the role of sST2 in relation to LV remodeling among T2DM patients not having heart failure and declining GFR. Perhaps, sST2 is desirably considered as an early biomarker of adverse cardiac remodeling in the diabetic population. Therefore, normal and near-normal GFR with microalbuminuria and elevation of circulating levels of NGAL reflecting early stage of diabetes mellitus-induced nephropathy do not have pervasive predictive potency for adverse cardiac remodeling in hypertensive patients with T2DM [31, 32].
Recent clinical studies and prospective ASIAN-HF (Asian Sudden Cardiac Death in Heart Failure) Registry have revealed that in both heart failure (HF) phenotypes (HF with reduced [HFrEF] and preserved [HFpEF] ejection fraction) T2DM (versus non-T2DM) was associated with smaller indexed LV diastolic volumes and higher mitral E/e' ratio that indicated on diastolic filling abnormality [33-35]. There was a predominance of eccentric hypertrophy in HFrEF and concentric hypertrophy in HFpEF in patients having T2DM. In this context, biomarkers of adverse cardiac remodeling, fibrosis, and biomechanical stress, such as sST2, appear to be attractive for further evaluation. The different ability of sST2 and cystatin C to be associated with LV remodeling and diastolic filling abnormality in T2DM and non-T2DM hypertensive patients, which was established in our study, requires performing new investigations in large clinical studies.
We suggest that metabolic alterations of intermediate substrate metabolism and oxidative stress rather than direct tubular kidney damage per se account for maladaptive cardiac remodeling and diastolic filling abnormality. Despite worsening kidney function can negatively impact cardiac structure and function through increased pressure overload and induce LV hypertrophy and consequently the development of HF, extracellular accumulation of collagen remains the primary mechanism for the occurrence of diastolic dysfunction in hypertensive patients with T2DM [36]. This sST2 is a mostly preferable biomarker that is suggesting higher susceptibility to the prediction of deleterious effects of chronic pressure overload due to hypertension and chronic kidney disease, among this T2DM population.
Study limitations
The study had some limitations. The first limitation was a small sample size. The second limitation is excluding from the study patients having GFR<60 mL/min/1.73 m2. The third limitation is a result of an absence of the subpopulation of normotensive patients having T2DM. However, these limitations do not lead to a significant misunderstanding of the results received in the study.
Conclusion:
Cardiac remodeling in hypertensive patients having T2DM was significantly associated with higher levels of sST2 and cystatin C. sST2 had the best potency to predict LV remodeling when compared with NGAL and other biomarkers.
Authors’ contribution
OMB designed the study protocol and proposed the idea of investigation. OMB, IMK, MVB, DAK, and OA obtained findings, analyzed the data, and reviewed the manuscript. AEB analyzed the data and wrote, edited, and reviewed the manuscript. MVB and LPA performed data collection, analyzed the statistics data, and checked the accuracy of the data analysis. IMK, LPA, and OMK performed ultrasound examinations and analyzed the results of it. OMK and LPA collected blood samples and performed the measurement of circulating biomarker concentrations. All authors read and approved the final version of the manuscript.
Acknowledgments
We thank staff person of Clinical Pharmacology and Internal Medicine department (Kharkiv National Medical University, Kharkiv, Ukraine) and Government Institution “L.T.Malaya Therapy National Institute NAMSU” (Kharkiv, Ukraine) as well as patients for participation in the study. We also thank a team of foreign languages department (Kharkiv National Medical University, Kharkiv, Ukraine) for assistance in manuscript preparation.
Competing interests
Authors have no competing interests
Ethics approval and consent to participate
The study was approved by the local ethics committee of Kharkiv National Medical University, Kharkiv, Ukraine. All patients gave their voluntary consent to participate in the study
Funding
This study was not supported by the non-commercial organizations and funds. Kharkiv National Medical University was the only source of financial supporting.
Abbreviations
ACE – angiotensin-converting enzyme
ADA – American Diabetic Association
ASE - American Society of Echocardiography
BMI - body mass index
CHF – chronic heart failure
CV – cardiovascular
DBP - diastolic blood pressure
ECS – European Cardiology Society
GFR - glomerular filtration rate
HbAc1 – glycosylated hemoglobin
HDL - high-density lipoprotein cholesterol
HOMA-IR – Homeostatic Assessment Model of Insulin Resistance
HR – heart rate
LDL - low-density lipoprotein cholesterol
LV – left ventricular
LVMM - LV myocardial mass
LVMMI – LV myocardial mass index
SBP – systolic blood pressure
T2DM – type 2 diabetes mellitus.
References