Pharmacophore an International Research Journal
EVALUATION OF THE EFFECT OF INULIN ON METABOLIC PROCESSES
Ayub Akhmadovich Bochaev1, Liana Islamovna Akmurzaeva1, Abdul-Malik Shaptinovich Imurzaev2, Islam Khavazhievich Tseltsaev2, Abdulkarim Saidiyatovich Khazuev2, Fariza Ruslanovna Khasbulatova3, Sherkhan Shaipovich Gaziev2, Murad Alievich Timirgireev1*
|
|
|
ABSTRACT
The effect of introducing soluble dietary fiber (5% inulin) into the diet on correcting vitamin D and group B deficiency and its consequences has been studied. The study was conducted on growing male Wistar rats (body weight 51.4 ±0.5 g) after they had a deficiency caused by a decrease in the content of vitamins D and group B in a vitamin mixture of a semi-synthetic diet for 23 days. The improvement of the rodent slim down with inulin did not influence the retention of vitamins A and D by lacking creatures amid the 7-day adjustment of vitamin status, whereas to some degree abating the reclamation of ordinary vitamins B1 and B6 urinary excretion, and B2 brain substance. At the same time, the substance of vitamin E within the liver was diminished by 1.48 times compared to the control bunch, the concentration of press within the blood plasma was expanded by 32.7, within the liver by 42.6, the substance of manganese within the brain was extended by 1.5 times, which does not surpass the physiological standard. This demonstrates the convenience of improving the slimming down of individuals with a pressing lack of inulin while enhancing with vitamins E and group B.
Keywords: Micronutrients, Vitamins, Inulin, Metabolism, Trace elements
Introduction
Adequate dietary fiber intake reduces cholesterol and glucose levels in the blood, normalizes the motility of the gastrointestinal tract, promotes obesity prevention, and reduces the risk of developing cardiovascular diseases, colon cancer, cholelithiasis, diabetes mellitus [1-3].
Many biologically active additives and fortified foods are created mechanically by combining (mixing) several components in one serving, each of which has beneficial properties for the body [4, 5]. At the same time, it is assumed that each ingredient that enters the body from the product will not only be absorbed but will also positively affect a particular function of the body [6, 7]. This approach does not always justify itself. For example, the presence of starch in a specialized product in the form of jelly containing all the vitamins prevented the absorption of vitamin B2 [8, 9]. In a specialized food product, which is positioned as a source of vitamins and soluble dietary fiber, the simultaneous presence of inulin, gum Arabic, and pectin, in a total dose of 300% of the adequate level of consumption of soluble dietary fiber, worsened the indicators of the provision of patients with vitamin E and beta-carotene, despite their presence in the product [10]. The high content of dietary fiber (43 g/day. oat bran) reduced the absorption of vitamins E, B2, and β-carotene but did not affect the bioavailability of vitamin C [11]. Enriching the diet with wheat or oat bran, chitosan, and pectin worsened the body's supply of vitamins E, B2, and beta-carotene [12-14].
Inulin is a natural linear polysaccharide (polypructosan) of sweet taste and belongs to the group of dietary fibers obtained from chicory and Jerusalem artichoke roots [15]. Inulin is a substrate for beneficial bacteria in the colon, which is why it is used as a prebiotic [16, 17]. Inulin is a non–toxic, biodegradable, cheap ingredient with a variety of functions. In the food industry, it is used as a texture modifier, fat substitute, sugar substitute, and prebiotic [18, 19].
Despite the widespread use of inulin in the food industry, there is only some, sometimes contradictory, information about its effect on vitamin metabolism and the antioxidant status of the body. It has been shown that in humans and rats of different ages, inulin intake increases intestinal absorption of calcium (especially in older rats) and magnesium [20]. The inclusion of inulin in the diet of piglets led to an increase in the concentration of iron, copper, and zinc in the blood plasma compared with animals receiving the same vitamin and mineral premix but without inulin additives [21]. One explanation for the increased iron uptake may be the decrease in the concentration of hepcidin, a 25-amino acid peptide hormone produced in the liver and a central regulator of iron homeostasis, found in children after ingestion of inulin enriched with oligofructose [22]. At the same time, in women with anemia, the consumption of 20 g of inulin per day for 4 weeks did not cause an increase in iron absorption. However, changes in the composition of the intestinal microbiota and a decrease in fecal pH were observed [23].
In experiments on mice, it was shown that inulin does not hurt cholesterol metabolism [24]. Inulin consumption has a positive effect on the antioxidant status of laying hens, which was manifested in an increase in the activity of superoxide dismutase, catalase, and glutathione peroxidase in the blood and a decrease in the level of malondialdehyde (MDA) [25]. Reception by healthy persons for 7 weeks of inulin with L. casei had a positive effect on markers of oxidative stress (a decrease in blood concentrations of MDA, H2O2, oxidized glutathione and a significant increase in the concentration of reduced glutathione and SH groups compared with the control group) [26].
According to other data, the inclusion of inulin in the diet of piglets did not improve the redox balance in the colon and led to a decrease in the activity of DNA repair enzymes [27]. Reception by children suffering from celiac disease, 10 g of inulin for 3 months. It contributed to an increase in the level of vitamins D and E in the blood and did not affect the concentration of vitamin A [28].
The purpose of the study: to study the effect of the introduction of inulin into the diet on the correction of vitamin D and group B deficiency and its consequences in growing rats deficient in these vitamins.
Materials and Methods
Experimental animals, male Wistar rats, were used in the work. The animals were kept in 2 individuals in transparent polycarbonate cages under controlled environmental conditions. environment (temperature 20-26 ° C, relative humidity 30-60%, in lighting mode 12/12 h) on a litter of sawdust. The animals were fed ad libitum and had constant access to distilled water [29].
Before the start of the experiment, during 5 days of quarantine, all animals (n=43) received a full-fledged semi-synthetic diet containing 20% food acid casein, 63% corn starch, 4.5% sunflower oil, 4.5% lard, 3.5% standard salt mixture, 2% microcrystalline cellulose, 1% dry vitamin mixture, 0.30% L-cysteine, 0.25% choline bitartrate and 0.95% sucrose.
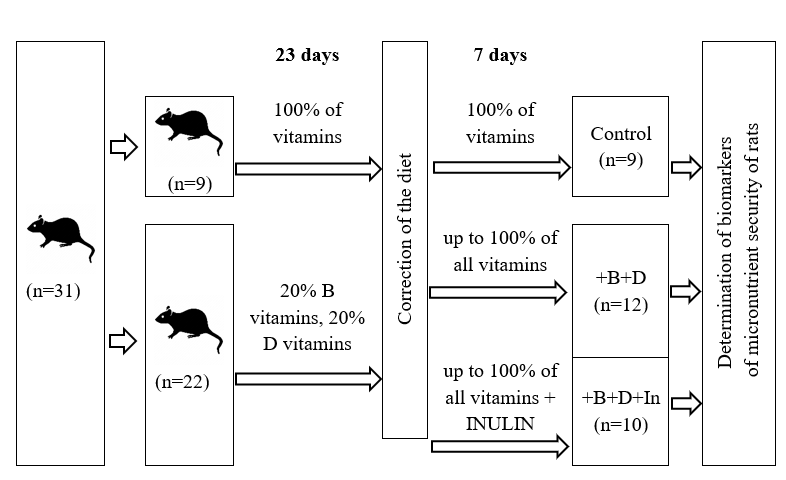
At the end of isolate, the rats were arbitrarily separated into two bunches by body weight. The creatures of the control gather bunch 1 all through the test 30 days kept on get a full fledged slim down n 9, and the test bunch n 34 for 23 days gotten nourishment with a 5 fold decreased substance of vitamin D and all B vitamins within the vitamin blend of the diet (Figure 1).
The average feed intake in the control and experimental groups during the period of deficit creation did not differ (p = 0.529) and amounted to 20.7 ± 0.6 (Me = 20.5) and 21.1 ± 0.8 (Me = 21.3) g/day, respectively.
Then the animals of the experimental group with vitamin deficiency were randomly divided by body weight into 2 subgroups of 10 and 12 individuals each (Figure 1). During the next 7 days, these experimental animals were kept on "replenishing" diets aimed at correcting vitamin deficiency, replenishing the deficiency of vitamin D and B vitamins up to 100% of the content in the diet of the control group against the background of the standard diet (+D+B) and against the background of replacing 5% starch with inulin (+D+B+ Inulin).
Rats were placed in metabolic cells, deprived of food, and provided with water without restriction in order to collect urine 20 hours before slaughter. At the end of the experiment, rats previously anesthetized with ether were removed from the experiment by decapitation [30].
|
|
|
Figure 1. Experimental scheme |
To determine by high-performance liquid chromatography, the concentration of vitamins A (retinol and retinol palmitate) and E (α-tocopherol) in blood plasma, freeze-dried liver, and the whole brain of rats [31]. Vitamins B1 and B2 (after acid enzymatic hydrolysis) in the liver, vitamin B2 in urine and plasma, and 4-pyridoxylic acid (4-PC) in urine were measured fluorometrically [32]. The concentration of 25-hydroxyvitamin D (25(OH)D) blood plasma was established by the enzyme immunoassay [33].
Plasma biochemical parameters (calcium, magnesium, iron, phosphorus, glucose, total bilirubin, direct bilirubin, urea, total protein, globulin, creatinine, uric acid, cholesterol (CS), triglycerides (TG), alanine aminotransferase (ALT) activity), aspartate aminotransferase (AST) and alkaline phosphatase were measured on a biochemical analyzer according to standard methods.
Experimental data were processed using SPSS Statistics 23.0 (IBM, USA). The nonparametric Mann-Whitney U–test for independent variables and the nonparametric Kraskell–Wallace criterion were used to identify the statistical significance of the differences in continuous quantities. The differences between the analyzed indicators were considered statistically significant at p < 0.05.
Results and Discussion
The study of the effect of the introduction of 5% inulin into the diet on the absorption of vitamins and eliminating the consequences of vitamin deficiency was carried out during the correction of deficiency in rats lacking vitamins of groups D and B.
By the end of the stage of vitamin D and group B deficiency, which lasted 23 days, the average body weight of animals of the vitamin–deficient (–D -B) group was 198.5±2.4 g (Iu = 199.3 g) and was statistically significantly 5.7% less (p = 0.046) than that of the control group (210.4 ± 4.6 g, Iu = 203.5 g), which was indirect evidence of the development of alimentary deficiency of these micronutrients in rats. Statistically significant differences in the absolute mass of organs (liver and brain) were observed, but no animals of the control and experimental groups were identified.
Supplementation of the deficient vitamin for 7 days with diets in the absence and presence of inulin completely reversed the growth retardation caused by vitamin deficiency. Also, it affected most of the plasma, liver, and brain parameters (Tables 1-3). The exceptions were iron and manganese. In animals after correction of vitamin status against the background of inulin introduction into the feed, the level of iron in blood plasma was statistically significantly higher by 32.7% compared with that in rats with eliminated vitamin deficiency who did not receive inulin, remaining within the physiological norm (17.4–61.0 mmol/L). Similar results were obtained when inulin was added to the diet of piglets, which led to an increase in the plasma concentration of not only iron but also copper and zinc compared with the indicator in animals receiving the same vitamin-mineral premix, but without the addition of inulin [34].
The addition of inulin to the diet of rats did not affect the level of cholesterol and other indicators of lipid metabolism, as well as the concentration of uric acid (Table 1). This fact does not agree with the data of other researchers who found that the consumption of inulin in approximately the same amounts for a longer period (4 weeks) by older rats of both sexes (9 weeks) led to a decrease in the concentration of cholesterol and uric acid in the blood plasma [35].
As follows from Table 3, even though there was no vitamin E deficiency in the diet of rats, the lack of other vitamins led to a decrease in its content in the liver, especially noticeable against the background of the addition of inulin to the diet, which persisted after 7 days of replenishing the lack of vitamins D and group B. At the same time, the level of α-tocopherol in the brain rats from different groups did not differ statistically significantly.
Inulin administration had no effect on the recovery of vitamin A, B1, and B2 levels in the liver. Still, the recovery of vitamin B2 levels in the brain was delayed after adding the deficient vitamin to the diet of vitamin-deficient rats.
Table 1. Biochemical parameters of rat blood plasma after correction of vitamin D and group B deficiency with and without addition of inulin to the diet (M ± m)
|
Indicator |
Group 1 (control) |
Group 2 (+D+B) |
Group 3 (+D+B+inulin) |
|
HDL, mmol |
1.45 ± 0.11 |
1.32 ± 0.07 |
1.45 ± 0.10 |
|
Cholesterol, mmol |
1.82 ± 0.15 |
1.70 ± 0.08 |
1.85 ± 0.11 |
|
Triglycerides, mmol |
0.86 ± 0.15 |
0.82 ± 0.09 |
0.81 ± 0.14 |
|
Glucose, mmol/l |
8.0 ± 0.4 |
8.4 ± 0.3 |
8.7 ± 0.3 |
|
AST, Units/l |
223 ± 12 |
197 ± 6 |
196 ± 5 |
|
ALT, Units/l |
56.9 ± 2.4 |
51.8 ± 1.1 |
48.9 ± 2.1 |
|
AST/ALT |
4.0 ± 0.3 |
3.8 ± 0.1 |
3.9 ± 0.2 |
|
LDG, Unit/l |
1506 ± 108 |
1486 ± 88 |
1599 ± 120 |
|
Total protein, g/l |
67.6 ± 1.6 |
67.2 ± 1.1 |
67.4 ± 1.7 |
|
Total bilirubin, µmol/l |
4.5 ± 0.6 |
4.9 ± 0.5 |
6.3 ± 1.2 |
|
Straight bilirubin, µmol/l |
3.3 ± 0.4 |
3.9 ± 0.5 |
4.5 ± 0.5 |
|
Globulins, g/l |
32.7 ± 0.9 |
34.2 ± 0.9 |
33.9 ± 1.3 |
|
Iron, µmol/l |
21.6 ± 3.9 |
33.6 ± 3.7 |
44.6 ± 4.7 |
|
Calcium, mmol/l |
3.01 ± 0.09 |
2.76 ± 0.13 |
2.85 ± 0.12 |
|
Magnesium, mmol/l |
1.03 ± 0.02 |
1.01 ± 0.02 |
0.99 ± 0.02 |
|
Phosphorus, mmol/l |
3.19 ± 0.08 |
2.97 ± 0.09 |
2.97 ± 0.13 |
|
Alkaline phosphatase, Units/l |
745 ± 88 |
588 ± 57 |
620 ± 50 |
|
Osteocalcin, ng/ml |
1066 ± 43 |
1050 ± 34 |
947 ± 43 |
|
Albumin, g/l |
33.3 ± 0.6 |
33.0 ± 0.5 |
33.5 ± 0.5 |
|
Creatinine, µmol/l |
47.2 ± 0.4 |
48.3 ± 0.7 |
47.0 ± 1.3 |
|
Uric acid, µmol/l |
47.9 ± 4.9 |
44.0 ± 3.6 |
50.3 ± 4.4 |
|
Urea, mmol/l |
5.3 ± 0.5 |
6.1 ± 0.3 |
6.4 ± 0.4 |
HDL – high-density lipoproteins, AST – aspartate aminotransferase, ALT – alanine aminotransferase, LDH – lactate dehydrogenase.
Table 2. Effect of correction of the combined deficiency in the diet of rats of vitamins D and group B on the background of the addition and without the addition of inulin to the diet on the concentration of vitamins in blood plasma (M ± m)
|
Indicator |
Group 1 (control) |
Group 2 (+D+B) |
Group 3 (+D+B+inulin) |
|
25(OH)D, ng/ml |
9.8 ± 0.5 |
8.8 ± 0.4 |
9.5 ± 0.7 |
|
Riboflavin, ng/ml |
38.2 ± 1.9 |
41.4 ± 4.4 |
37.4 ± 1.4 |
|
Retinol, µg/dl |
35.4 ± 2.0 |
34.6 ± 2.1 |
38.4 ± 2.4 |
|
α-Tocopherol, mg/dl |
1.15 ± 0.14 |
1.00 ± 0.08 |
1.18 ± 0.11 |
|
α-Tocopherol/TG, µmol/mmol |
34.0 ± 4.1 |
30.0 ± 3.5 |
32.6 ± 2.4 |
|
α-Tocopherol/ CS, µmol/mmol |
15.3 ± 2.1 |
13.7 ± 1.0 |
15.0 ± 1.2 |
|
α-Tocopherol/(TG+ CS), µmol/mmol |
10.1 ± 1.1 |
9.3 ± 0.8 |
10.3 ± 0.6 |
CS – cholesterol, TG – triglycerides
Table 3. Effect of correction of combined deficiency in the diet of rats of vitamins D and group B on the background of inulin addition and without addition to the diet on biomarkers of vitamin and mineral availability in the liver and brain of rats (mcg per 1 g of raw tissue) (M ± m)
|
Indicator |
Group 1 (control) |
Group 2 (+D+B) |
Group 3 (+D+B+inulin) |
|
Liver |
|||
|
Retinol palmitate, µg RE |
10.5 ± 0.6 |
9.0 ± 0.6 |
9.8 ± 1.0 |
|
α-Tocopherol |
194 ± 26 |
137 ± 19 |
113 ± 11 |
|
Vitamin B1 |
10.0 ± 0.8 |
9.9 ± 0.6 |
10.3 ± 0.6 |
|
Vitamin B2 |
27.6 ± 1.1 |
28.6 ± 0.5 |
27.5 ± 0.3 |
|
Calcium |
1200±50 |
1330±50 |
1200±30 |
|
Magnesium |
187±0.008 |
200±0.003 |
186±0.007 |
|
Iron |
48.4±4.4 |
55.6±3.7 |
69.0±6.0 |
|
Manganese |
1.56±0.10 |
1.67±0.06 |
1.73±0.07 |
|
Zinc |
34.8±1.0 |
34.7±1.4 |
33.6±1.3 |
|
Copper |
3.27±0.17 |
3.11±0.14 |
3.13±0.23 |
|
The whole brain |
|||
|
α-Tocopherol |
17.9 ± 0.8 |
18.9 ± 0.6 |
19.3 ± 0.6 |
|
Vitamin B1 |
4.59 ± 0.24 |
4.88 ± 0.29 |
4.39 ± 0.14 |
|
Vitamin B2 |
2.68 ± 0.09 |
2.44 ± 0.08 |
2.26 ± 0.08 |
|
Calcium |
753±50 |
750±34 |
767±31 |
|
Magnesium |
142±7 |
136±4 |
134±3 |
|
Iron |
22.5±1.9 |
19.6±1.2 |
20.7±1.1 |
|
Manganese |
1.00±0.20 |
1.46±0.17 |
1.51±0.11 |
|
Zinc |
11.6±0.3 |
11.0±0.2 |
11.1±0.3 |
|
Copper |
1.31±0.30 |
1.44±0.19 |
1.18±0.26 |
The presence of vitamin D and group 2 in the diet of deficient laboratory animals and subsequent supplementation of the levels of these vitamins to sufficient values without the addition of inulin to the diet (group 2) has no effect on the content of measured elements in edible rat liver (Table 3). Against the background of inulin in rats after correction of the combined vitamin deficiency (group 3) was observed statistically significantly higher (by 42.6%) concentration of iron in the liver relative to the indicator in the control and by 24.4% (p<0.10) relative to the indicator in the experimental group of animals that did not receive inulin (group 2). Against the background of inulin consumption, the level of manganese in the liver of rats was slightly higher compared to the control by about 10% (p<0.10) in the absence of statistically significant differences in this indicator in animals of experimental groups 2 (+D+B) and 3 (+D+B+inulin).
In rats, after correcting the combined deficiency in the diet of vitamins D and group B by replenishing their content to an adequate level, the manganese content in the brain of rats of the experimental group 2 (+D+B) exceeded 1.46 times (p<0.10) the corresponding indicator in animals of the control group. After the correction of vitamin deficiency on the background of inulin, the level of manganese in the brain was increased by 1.51 times (p<0.05) in rats compared with the indicator of the control group rats. The absence of statistically significant differences between the indicators of animals of experimental groups 2 and 3 allows us to conclude that the combined lack of vitamins D and group B in the diet, and not inulin, which, apparently, only enhances this process, affects the accumulation of manganese in the brain of rats. Since statistically significant deviations in the content of the remaining studied elements in the brains of animals of experimental groups 2 and 3 from the corresponding indicators in group 1 (control) were not detected (Table 3), it can be assumed that the combined deficiency of vitamins D and group B selectively leads to the accumulation of manganese in the brain of rats, which requires further research to clarify mechanisms of this organ-specific influence, especially since excessive exposure to manganese can lead to neurodegenerative diseases similar to Parkinson's disease [36, 37].
Thiamine excretion (based on creatinine released) in rats against the background of inulin added to the diet and increased to an adequate level of missing vitamins (+D+B+Inulin) was 2.1 times lower compared to the values in rats of the control group and animals from the vitamin deficiency correction group without adding inulin (+B+D) to the feed. Similarly, the excretion of the vitamin B6 – 4-PC metabolite was reduced by about 2.2 times (Table 4).
Table 4. Biomarkers of micronutrient status in rat urine after correction of vitamin deficiency with and without addition of inulin to the diet (M ± m)
|
Indicator |
Group 1 (control) |
Group 2 (+D+B) |
Group 3 (+D+B+inulin) |
|
Thiamine / creatinine, µg/g |
1.1 ± 0.2 |
1.6 ± 0.3 |
0.52 ± 0.14 |
|
Riboflavin/creatinine, µg/g |
8.8 ± 0.6 |
8.7 ± 0.5 |
10.1 ± 1.0 |
|
4-PC / creatinine, µg/g |
11.2 ± 1.0 |
9.8 ± 1.0 |
5.0 ± 1.1 |
|
Glucose, mmol |
3.6 ± 0.7 |
3.2 ± 0.6 |
3.6 ± 0.5 |
|
Calcium, mg |
0.93 ± 0.21 |
0.68 ± 0.13 |
0.86 ± 0.25 |
|
Creatinine, mg |
4.4 ± 0.3 |
4.2 ± 0.2 |
4.6 ± 0.2 |
|
Calcium/creatinine, mg/g |
0.20 ± 0.04 |
0.16 ± 0.03 |
0.18 ± 0.05 |
|
Magnesium, µmol |
67.4 ± 11.1 |
45.9 ± 5.4 |
61.7 ± 6.3 |
|
Phosphorus, µmol |
0.36 ± 0.04 |
0.41 ± 0.05 |
0.50 ± 0.03 |
|
Phosphate reabsorption, % |
84.5 ± 2.6 |
82.2 ± 1.7 |
80.3 ± 2.3 |
|
Uric acid, µmol |
11.0 ± 0.7 |
10.0 ± 0.6 |
10.9 ± 0.6 |
|
Urea, mmol |
3.2 ± 0.3 |
2.8 ± 0.2 |
3.3 ± 0.2 |
Conclusion
During the study of the effect of the introduction of soluble dietary fiber into the diet on the correction of vitamin D and group B deficiency and its consequences in deficient rats, the effect of inulin on the absorption of vitamins A, E, B1, and B2 and several minerals was evaluated. Judging by the content of vitamins in the organs, the enrichment of the diet. inulin did not affect the absorption of vitamin A by animals deficient in vitamins D and group B during the correction of vitamin status.
The introduction of inulin into the diet was accompanied by an increase in the concentration of iron in blood plasma and liver, but worsened the provision of vitamin E (in terms of liver content, reduced by 1.48 times compared to the indicator of the control group) and slowed down the restoration of normal body supply with vitamins B1, B6 and B2, which manifested itself in a reduced level of vitamin B2 in the brain and reduced excretion of thiamine and 4-PC. An increase in the excretion of water-soluble vitamins occurs when the body is fully saturated with vitamins, and a decrease in the excretion of water-soluble vitamins is an earlier sign of their deficiency. One possible explanation is a more delayed elimination of the deficiency of B vitamins (B1 and B6) against the background of the introduction of inulin into the diet. Against the background of inulin consumption, there was some lag in the restoration of vitamin B2 content in the brain, and the manganese content increased by 1.5 times. A positive aspect is an increase in the concentration of iron in the blood plasma and liver. This reflects an improvement in its absorption when inulin is included in the diet of rats and is consistent with the opinion of other authors about the benefits of inulin enrichment in the diet of people with iron deficiency conditions.
The data obtained indicate that the inclusion of soluble dietary fiber (inulin) in the diet must be accompanied by synchronous enrichment with vitamin E and vitamins of group B. This is also done when using chitosan [38], the addition of which to the diet of rats, without affecting the metabolism of vitamins C, B1, B2, and A, led to a decrease in the concentration of vitamin E in blood plasma. The inclusion of bran in the diet of rats also contributed to a significant decrease in the concentration of vitamin E in blood plasma and liver. Thus, if dietary fibers of various natures manifest themselves differently about B vitamins, then, regardless of their nature, their common property is a deterioration in the body's vitamin E supply during their consumption. Based on the results obtained, it is also important to note that the simultaneous presence of inulin and dietary fiber in the composition of dietary supplements or a food product does not guarantee the complete assimilation of all added vitamins, especially against the background of existing multiple vitamin deficiencies, and can also lead to unforeseen consequences (an increase in the level of manganese in the brain).
In other words, the expected effectiveness of an enriched product or dietary supplement for the correction of vitamin and mineral status may be significantly reduced, which indicates the need for clinical testing, confirming the bioavailability of enriching components and effectiveness for maintaining health.
Acknowledgments: The authors are thankful to colleagues from North Ossetian State Medical Academy for their assistance in the experiment.
Conflict of interest: None
Financial support: None
Ethics statement: None