Pharmacophore an International Research Journal
FINANCIAL EVALUATION AND PATTERN OF ANTIBIOTIC CONSUMPTION IN INTENSIVE CARE UNITS OF A UNIVERSITY HOSPITAL
Viviana Hodoșan1, Dana Carmen Zaha2*, Lucia Georgeta Daina3, Alina Manuela Tîrb2, Lavinia Florica Mărcuț1,4, Aurel George Mohan4, Petru Cotrău1, Cristian Marius Daina4
|
|
|
ABSTRACT
Antimicrobial resistance (AMR) is an important global public health issue and intensive care units (ICUs) are the first target for monitoring antibiotic consumption because of their important antibiotic use. We performed a monocentric, retrospective, and observational study for five years to evaluate the consumption and cost of antibiotics in the ICUs of Oradea County Emergency Clinical Hospital, Romania. The prescribed antibiotic amount was expressed in DDD/100 patient days and costs in EUR. The first ten antibiotics prescribed represent 84.81% of the total, and ceftriaxone and amoxicillin/clavulanic acid are half of them. Most antibiotics prescribed belong to the WHO Watch category and less to Access contrary to recommendations. The highest costs related to antibiotic therapy in the ICUs were for prescriptions of ceftazidime/avibactam, cefoperazone/sulbactam, colistin, meropenem, tigecycline, ceftriaxone, amoxicillin/clavulanic acid, moxifloxacin, ertapenem, vancomycin, linezolid, ciprofloxacin and piperacillin/tazobactam. The costs with the prescriptions of meropenem, tigecycline, vancomycin, moxifloxacin, and ciprofloxacin show an increasing trend, while the costs with the prescriptions of ceftriaxone, amoxicillin/clavulanic acid, ertapenem, piperacillin/tazobactam were relatively constant.
Our results provide several aspects of inappropriate use of antibiotics which allowed measures to avoid certain expenses and an important step towards the rationalization of antibiotic use
Keywords: Antibiotics, Intensive care units, Costs, Antimicrobial resistance
Introduction
Appropriate antibiotic use has become an important issue in hospitals and ambulatory not only because of antimicrobial resistance (AMR) but also to control the outcome and medical expenditure. Antibiotic consumption is especially increased in intensive care units (ICUs), which could consume more than a quarter of hospital budgets, although there are the departments with the lowest number of beds [1].
Consumption of carbapenems, polymyxin, and oxazolidinone antibiotics, used in the treatment of hospital-acquired infections caused by multidrug-resistant bacteria, is also increasingly contributing to AMR [2, 3]. There are concerns for increasing carbapenemase-producing Enterobacterales, especially Klebsiella pneumoniae, Acinetobacter baumannii, higher resistance rates to vancomycin of Enterococcus spp, resistance rates to trimethoprim-sulfamethoxazole. The World Health Organization (WHO) issued a warning signal in 2011 to prevent further worsening of AMR and called for urgent and efficient actions to decrease it [4-6]. It is well known that inappropriate use of antibiotics is the trigger for the emergence of antimicrobial-resistant pathogens, it also has an economic impact caused by extra medical expenses. There is a need for the implementation of antimicrobial stewardship programs in both hospitals and communities.
The first step to combat antibiotic overuse is to evaluate the severity of the issue, meaning the current antimicrobial pattern across sectors and departments including both hospital and ambulatory care [7]. It requires a proper measurement of antibiotic consumption and the epidemiology of circulating strains. These are followed by the understanding of the level of antimicrobial resistance providing useful data for hospitals or others to implement the proper measures and guidelines for the proper antibiotic usage.
There are challenges in measuring antibiotic consumption, but for monitoring and comparing antibiotic use a useful and widespread tool is the ATC/DDD system established by the WHO International Working Group for Drug Statistics Methodology. It classifies drugs according to the ATC system and establishes Defined Daily Doses (DDDs) for drugs that have been assigned an ATC code [8].
A large proportion of antimicrobials are prescribed and administered for respiratory tract infections that are essentially viral in origin [9, 10], including the recent COVID-19 pandemic despite the limited number of bacterial or fungal co-infections [10]. Urinary tract infections (UTIs) are commonly encountered infectious pathologies in the community and healthcare-associated and they represent a major factor of morbidity and mortality. These infections are frequently associated with recurrence or complications, even if the appropriate antimicrobial therapy was administered and they also lead to higher costs of treatment [11, 12].
Consumption of antibiotics used in the treatment of hospital-acquired infections is another important resource for AMR and there are changes in the distribution of bacteria growing in culture and in the rates of antibiotic resistance during the COVID-19 pandemic. A study conducted by Hughes et al. reported a low frequency of bacterial co-infection during early COVID-19 hospitalization, but more studies demonstrated bacterial infection began to appear in severe cases of COVID-19 for those patients who required intensive care unit (ICU) admission and mechanical ventilation therapy. These cases are described as co-infections with Streptococcus pneumoniae, Staphylococcus aureus, Pseudomonas aeruginosa, Escherichia coli, Klebsiella pneumoniae, and Haemophilus influenzae. These pathogens are involved in community and hospital-associated infections and all patients receive antibiotics [13, 14]. During the COVID-19 pandemic, the most relevant antibiotic-resistant pathogens causing healthcare-associated infections (HAIs) included methicillin-resistant Staphylococcus aureus, carbapenem-resistant Enterobacterales, carbapenem-resistant Acinetobacter baumannii, and vancomycin-resistant enterococci [15].
Data about circulating strains is better explored by using cumulative susceptibility test data provided by a microbiology laboratory. It has at least two applications, to guide empirical antimicrobial therapy and to detect changes in AMR. The recommended methodologies for cumulative susceptibility test data have been published by the Clinical and Laboratory Standards Institute (CLSI) and The European Committee on Antimicrobial Susceptibility Testing (EUCAST) [16, 17]. Both recommended data about cumulative susceptibility to be generated annually, and, to ensure adequate statistical power, CLSI guidelines recommend that only organisms with a minimum of 30 isolates be reported. In the same report, it is better to specify patient location (hospital or ambulatory), type of department, age, and specific clinical conditions. By filling in more data about the patient and cultures from the report, duplicates can be observed and eliminated. The first pathogen isolate per patient was considered, regardless of specimen type, as recommended by CLSI and EUCAST. Through the comparative evaluation of antibiotic sensitivity rates of isolated strains from one year to another, the trend of AMR can be observed and measures can be proposed.
The goal of this paper is to explore the prevalence, characteristics, and costs of antibiotic prescribing in the ICUs to determine the targets for improving the use of antibiotics and costs.
Materials and Methods
This retrospective study was carried out at the Oradea County Emergency Clinical Hospital for five years (2017-2021), using electronically recorded data at the level of the hospital with reference to intensive care units (adults), intensive care for coronary and neurological patients, and newborns. This hospital is classified in the first category meaning an extended competence level for the ICU departments and the higher level of the maternity.
Antibiotic administration and cost data were collected from the hospital's InfoWorld software program through reports containing antibiotics administered, dose, route of administration, and costs. These data were extracted from the information system of the pharmacy. From the point of view of costs, antibiotics consumption was extracted as RON and expressed in EUR considering the exchange every year. The prescribed quantities were expressed in DDD/100 patient-days (DDD/100 PD), according to the Statistical Methodology of Medicine of WHO, using the Anatomical Therapeutic Chemical (ATC)/DDD Index 2022 [18]. We performed an analysis of antibiotic consumption using the AWARe classification developed by the World Health Organization (WHO) expert committee using the 2017 Essential Medicines List (EML) [19-22]. The updated 2021 AWARe classification includes a total of 258 antibiotics classified into Access, Watch, Reserve, and Not recommended groups, considering the impact of different antibiotics or classes on the development of antimicrobial resistance and the importance of their proper use. The Access group consists of antibiotics with the best therapeutic value, while reducing the potential for resistance development, being the first or second choice for the 25 most common infections. The Watch group includes antibiotics indicated for several critical infectious diseases, but these may be a target of antibiotic resistance and their prescriptions should be monitored. The Reserve Group is the last option when other antibiotics have failed for highly selected patients (such as infections caused by multidrug-resistant bacteria), monitored very closely, and prioritized as targets of administration schedules to ensure continued efficacy.
Written informed consent of individual patients wasn’t necessary but was obtained at admission, and the hospital's ethics committee approved the conduct of this study.
Descriptive statistics were used to express results as means and percentages. All statistical analyses were performed using Excel software, and antibiotic prescribing trends were analyzed using the Mann-Kendall test. The results were considered statistically significant if p<0.05, indicating a statistically significant increasing or decreasing trend.
Results and Discussion
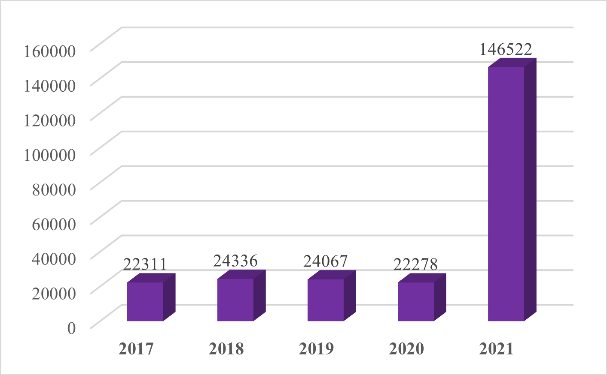
The number of patient days in ICUs during the evaluated period was relatively the same between 2017 and 2020, but in 2021 it recorded a significant increase, practically almost seven times compared to the previous year (Figure 1).
|
|
|
Figure 1. The number of patient days between 2017-2021 |
Despite this increase, during the five evaluated years, the consumption of antibiotics in the ICUs was relatively stationary, the prescribed antibiotics being dependent on the conditions done by the COVID-19 pandemic, and the lowest consumption of antibiotics expressed as DDD/100 PD was recorded in the ICUs (13.76%) compared to the whole hospital. However, it is worth mentioning the significant increase in the consumption of antibiotics at the hospital level in 2021, but without an increase in consumption in ICUs (Table 1).
Table 1. Antibiotic consumption in the ICUs is expressed as DDD/100 PD.
|
2017 |
2018 |
2019 |
2020 |
2021 |
|
|
ICUs |
398.87 |
368.77 |
381.04 |
389.66 |
344.59 |
|
Total hospital |
1978.26 |
1661.21 |
1664.38 |
2381.77 |
5981.80 |
The most prescribed doses of antibiotics were for ceftriaxone (47.78%), amoxicillin/clavulanic acid (6.83%), metronidazole (5.71%), cefoperazone/sulbactam (5.49%), ciprofloxacin (4.44%), cefuroxime (4.43%) meropenem (3.59%), moxifloxacin (2.71%) totaling 80.98% of the total doses prescribed in the cumulative five years. If we also consider the doses of levofloxacin and vancomycin, the first ten antibiotics prescribed represent 84.81% of the total, and ceftriaxone and amoxicillin/clavulanic acid are half of the total amount of antibiotics administered (Table 2). Instead, cefaclor, rifampicin, cefazolin, ofloxacin, and imipenem/cilastatin/relebactam were prescribed in small amounts and not in all the years evaluated.
Table 2. The first ten antibiotics prescribed at the ICUs cumulatively expressed as DDD/100 PD between 2017-2021
|
ATC code |
Active substance |
DDD/100 PD (%) |
|
J01DD04 |
Ceftriaxone |
899.56 (47.78) |
|
J01CR02 |
Amoxicillin/clavulanic acid |
128.64 (6.83) |
|
J01XD01 |
Metronidazole |
107.59 (5.71) |
|
J01DD62 |
Cefoperazone/sulbactam |
103.37 (5.49) |
|
J01MA02 |
Ciprofloxacin |
83.62 (4.44) |
|
J01DC02 |
Cefuroxime |
83.41 (4.43) |
|
J01DH02 |
Meropenem |
67.58 (3.59) |
|
J01MA14 |
Moxifloxacin |
50.93 (2.71) |
|
J01MA12 |
Levofloxacin |
37.83 (2.01) |
|
J01XA01 |
Vancomycin |
34.33 (1.82) |
The most prescribed antibiotics were administered predominantly parenteral with an average of 98.89%, which corresponds to the specificity of the evaluated departments or the existence of only injectable forms of some of them.
According to the AWARe classification, 72.12% of the antibiotics prescribed in the ICUs were from the Watch group, while only 19.52% were from the Access group, regardless of the evaluated year. The not recommended group was used more than the Reserve ones, and the evolution during the five years evaluated does not show a tendency to decrease the prescription of antibiotics from these classes. It should be mentioned that only cefoperazone/sulbactam was prescribed from the Not recommended group in our hospital. Access class antibiotic prescribing was slightly above the five-year average in 2019 and 2020 but with a downward trend in 2021. Watch class antibiotics were prescribed in amounts above the five-year average in three years, 2017 and 2020 showing a slight reduction in 2021. The prescription of antibiotics from the reserve antibiotic group showed an oscillating but increasing evolution (Table 3).
Table 3. Antibiotics prescribed according to the AWARe classification in the ICUs expressed as DDD/100 PD
|
AWARe grup (%) |
DDD/100 PD |
||||
|
2017 |
2018 |
2019 |
2020 |
2021 |
|
|
Access (19.52) |
78.02 |
70.80 |
80.14 |
80.83 |
57.75 |
|
Watch (72.12) |
299.37 |
262.77 |
269.28 |
279.34 |
247.27 |
|
Reserve (2.87) |
5.97 |
12.42 |
14.27 |
7.44 |
13.88 |
|
Not recommended (5.49) |
15.53 |
22.79 |
17.29 |
22.06 |
25.69 |
The annual average cost of antibiotics in ICUs was 178,288.89 EUR, with a positive trend, especially in recent years (Table 4). The dynamics of antibiotic therapy costs in ICUs in the total costs per hospital is increasing also.
Table 4. Antibiotic therapy costs at ICUs expressed in EUR
|
2017 |
2018 |
2019 |
2020 |
2021 |
Total |
|
|
ICUs |
91,516.85 |
120,680.6 |
154,193.6 |
177,709.7 |
347,325.7 |
891,426.5 |
|
Total hospital |
334,439.5 |
312,514.8 |
333,500.8 |
314,689.3 |
594,452.2 |
1,889,597 |
The highest costs related to antibiotic therapy in the ICUs were for prescriptions of ceftazidime/avibactam, cefoperazone/sulbactam, colistin, meropenem, tigecycline, ceftriaxone, amoxicillin/clavulanic acid, moxifloxacin, ertapenem, vancomycin, linezolid, ciprofloxacin and piperacillin/tazobactam, generating a total cost of 780,983.9 EUR i.e. 87.69% of total costs.
Table 5. Antibiotics consumed and related costs expressed as EUR between 2017-2021
|
ATC code |
Active substance |
2017 |
2018 |
2019 |
2020 |
2021 |
|
J01DD52 |
Ceftazidime/avibactam |
- |
- |
24,992.75 |
44,843.38 |
126,007.5 |
|
J01DD62 |
Cefoperazone/sulbactam |
19,464.39 |
25,271.76 |
20,771.46 |
28,446.33 |
54,283.91 |
|
J01XB01 |
Colistin |
15,610.68 |
19,545.01 |
23,290.92 |
12,130.05 |
39,247.94 |
|
J01DH02 |
Meropenem |
4,685.06 |
6,206.10 |
7,447.05 |
11,792.5 |
18,738.54 |
|
J01AA12 |
Tigecycline |
815.92 |
7,493.44 |
13,608.35 |
8,874.25 |
14,289.16 |
|
J01DD04 |
Ceftriaxone |
8,230.66 |
7,437.03 |
6,548.36 |
7,943.53 |
9,594.26 |
|
J01CR02 |
Amoxicillin/acid clavulanic |
8,265.16 |
6,504.48 |
6,166.97 |
6,800.17 |
7,486.09 |
|
J01MA14 |
Moxifloxacin |
4,743.28 |
5,092.32 |
5,163.54 |
7,980.41 |
10,996.77 |
|
J01DH03 |
Ertapenem |
7,139.18 |
6,448.1 |
6,757.96 |
4,565.88 |
8,278.49 |
|
J01XA01 |
Vancomycin |
785.41 |
4,647.28 |
4,871.44 |
7,716.68 |
13,035.2 |
|
J01XX08 |
Linezolid |
1,420.41 |
5,919.91 |
4,168.86 |
2,986.54 |
10,756.89 |
|
J01MA02 |
Ciprofloxacin |
2,614.02 |
2,687.68 |
3,438.44 |
4,573.88 |
5,305.93 |
|
J01CR05 |
Piperacillin/tazobactam |
4,658.12 |
4,711.59 |
2,241.62 |
761.69 |
3,683.17 |
|
J01XA02 |
Teicoplanin |
22.93 |
1,244.26 |
5,811.05 |
5,133.55 |
1,866.15 |
|
J01XD01 |
Metronidazol |
2,737.57 |
2,183.39 |
2,275.28 |
1,868.39 |
2,671.02 |
|
J01DD02 |
Ceftazidime |
1,259.25 |
1,527.31 |
1,908.65 |
2,642.25 |
3,808.69 |
|
J01DC02 |
Cefuroxime |
2,422.46 |
2,018.01 |
2,740.09 |
1,657.65 |
1,133.42 |
|
J01MA12 |
Levofloxacin |
1,876.5 |
2,391.06 |
611.03 |
1,721.50 |
2,740.82 |
|
J01FF01 |
Clindamycin |
444.38 |
2,597.47 |
2,260.45 |
2,012.74 |
1,818.55 |
|
J01GB06 |
Amikacin |
767.08 |
1,569.78 |
1,990.13 |
2,397.52 |
940.74 |
|
J01CR01 |
Ampicillin/sulbactam |
900.01 |
2,114.29 |
1,423.15 |
1,636.40 |
1,400.50 |
|
J01DE01 |
Cefepime |
- |
322.39 |
1,713.09 |
1,911.16 |
1,819.67 |
|
J01FA09 |
Clarithromycin |
1.55 |
339.86 |
567.44 |
4,427.47 |
183.42 |
|
J01DH51 |
Imipenem/Cilastin |
482.97 |
615.97 |
1,638.27 |
1,277.91 |
1,089.28 |
|
J01DH56 |
Imipenem/cilastatin/relebactam |
- |
- |
- |
- |
4,572.48 |
|
J01DD12 |
Cefoperazone |
1,097.73 |
560.79 |
129.41 |
56.14 |
79.37 |
|
A07AA11 |
Rifaximin |
420.98 |
299.15 |
353.33 |
285.65 |
489.65 |
|
J01GB03 |
Gentamicin |
152.89 |
149.90 |
190.13 |
274.79 |
423.27 |
|
J01CE01 |
Benzylpenicillin |
186.05 |
529.08 |
77.19 |
242.93 |
3.86 |
|
J01CA01 |
Ampicillin |
163.95 |
192.66 |
267.64 |
198.08 |
216.52 |
|
J01CF04 |
Oxacillin |
112.24 |
20.33 |
325.43 |
163.43 |
80.72 |
|
J01XX01 |
Fosfomycin |
- |
- |
343.07 |
133.87 |
135.99 |
|
J01FA01 |
Erythromycin |
- |
- |
56.36 |
16.35 |
120.85 |
|
J01DB04 |
Cefazolin |
- |
- |
- |
183.86 |
- |
|
J01AA02 |
Doxycycline |
4.16 |
9.38 |
17.51 |
23.47 |
12.12 |
|
J01FA10 |
Azithromycin |
4.95 |
7.71 |
6.23 |
22.51 |
21.59 |
|
J01DD08 |
Cefixime |
18.90 |
13.67 |
3.45 |
- |
4.26 |
|
J04AB02 |
Rifampicin |
- |
- |
9.38 |
3.51 |
3.82 |
|
J01CA04 |
Amoxicillin |
0.14 |
4.62 |
3.14 |
2.89 |
2.57 |
|
J01DC04 |
Cefaclor |
5.46 |
2.51 |
1.37 |
0.95 |
- |
|
J01MA06 |
Norfloxacin |
1.88 |
1.26 |
2.05 |
- |
0.90 |
|
J01MA01 |
Ofloxacin |
0.47 |
1.05 |
- |
- |
- |
Table 5 also expresses the cost trend of the antibiotics. An increasing trend shows the costs of the prescriptions of ceftazidime/avibactam, cefoperazone/sulbactam, and colistin which are up to 51.52% of the costs over the five years. The costs with the prescriptions of meropenem, tigecycline, vancomycin, moxifloxacin, and ciprofloxacin show an increasing trend, while the costs with the prescriptions of ceftriaxone, amoxicillin/clavulanic acid, ertapenem, piperacillin/tazobactam were relatively constant.
Table 6. Costs with antibiotics prescribed according to the AWARe classification expressed as EUR
|
AWARe grup |
2017 |
2018 |
2019 |
2020 |
2021 |
|
Access |
13,733.69 |
15,875.44 |
14,997.08 |
15,804.73 |
15,056.02 |
|
Watch |
40,471.83 |
46,575.09 |
52,362.77 |
64,625.17 |
83,130.32 |
|
Reserve |
17,847.01 |
32,958.37 |
66,060.88 |
68,834.22 |
194,874 |
|
Not recommended |
19,464.39 |
25,271.76 |
20,771.46 |
28,446.33 |
54,283.91 |
We evaluated the costs of antibiotic therapy according to the AWARe classification. If in the years 2017 and 2018 the highest costs were given by Watch antibiotics, in the last three evaluated years the highest costs were given by the Reserve class (Table 6). In addition, the cost trend shows relatively constant costs for the Access class, while the rest of the classes show a modest upward trend until 2020 and a significant one at the level of 2021.
The study focused on tracking the active substances and classes of antibiotics prescribed, and forms of administration, highlighting the most used antibiotics, respectively those prescriptions that significantly influenced both the budget and frequency of use. In this way, aspects arising from the practice of clinicians were highlighted, identifying critical points for possible measures implemented by those responsible: drug committee, and quality management system [23, 24].
It is also worth mentioning the partial overlap of the period under analysis (2020 and 2021 to be exact) with the COVID-19 pandemic, the method of prescribing medicines/antibiotics being influenced by this situation, unprecedented and difficult to manage. Being a work with an emphasis on specific aspects of management, we also considered the cost analysis aimed at highlighting certain aspects and at the same time offering solutions for improvement, namely the efficiency of how the available resources are managed.
Patient populations vary widely, even within the same institution, conducting to large differences in the clinical conditions and the need for therapy, but ICUs report an increased rate of resistance among isolated pathogens in comparison to the rate found in non-ICU settings. There are differences within different ICUs of the same hospital. For instance, in Italy and the UK, aminoglycosides are not used as frequently as in Korea [25, 26], which illustrates country-level differences; also, there are large differences in the consumption profiles for treatments of the same bacterial infection among European countries [27-29]. Our finding is that the first ten antibiotics prescribed represent 84.81% of the total, and ceftriaxone and amoxicillin/clavulanic acid are half of them.
The WHO recommendation for the period 2019–2023 is that at least 60% of the total national consumption of antibiotics must be covered by antibiotics from the Access group. In our study referring only to ICUs, most of the antibiotics prescribed were from the Watch group, while only 19.52% were from the Access group, regardless of the evaluated year.
A study conducted by Cupurdija et al. demonstrated the costs of hospital treatment of community-acquired pneumonia are mostly attributable to over-prescription of antibiotics [30]. More published studies have shown an increase in antimicrobial consumption in the context of the COVID-19 pandemic and the peak in antimicrobial use is in 2021 for our hospital [31]. The financial evaluation of the consumption of antibiotics in the ICUs shows moderately increasing expenses between 2017 and 2020 and four times in 2021 when compared to 2017. The average over the five years is 178,288.9 EUR. This value was exceeded only by the expenditure on antibiotic therapy in the years 2020 and 2021. In addition, the highest expenses with antibiotic therapy were registered at the level of ICUs (47%), i.e., almost half of the expenses in the whole hospital. In terms of administered doses, the fewest antibiotic doses (13.84%) were administered to intensive care patients, but the costs were significant. This shows a relatively low consumption of antibiotics in terms of the number of doses, but expensive. The most prescribed expensive antibiotics used in the ICUs were ceftazidime/avibactam, cefoperazone/sulbactam, colistin, meropenem, tigecycline, ceftriaxone, amoxicillin/clavulanic acid, moxifloxacin, ertapenem, vancomycin, linezolid, ciprofloxacin and piperacillin/tazobactam. Prescription costs for ceftazidime/avibactam were above the five-year average, although it was only prescribed starting in 2019. Moreover, cefoperazone/sulbactam and colistin represent a substantial share of the total expenditure on antibiotic therapy, approximately half of the spent budget (46.09%). And the trend of those prescriptions is not decreasing, just like those for ceftazidime/avibactam. If in 2017, the total cost recorded with antibiotics in the ICUs was 91,516.92 EUR, in 2021 the budget consumed was 347,344.2 EUR, registering an increase of almost four times. Statistically, from the total of 37 to 42 antibiotics used in each analyzed year, on average 9-12 of them were used above the recorded annual average, which leads to the delimitation of antibiotics preferred by clinicians or use according to the therapeutic protocol. Limitations of the study are next. First, it is a monocentric one covering five years but complicated by the pandemic COVID-19. However, there is a need to structure programs that will manage the use of antimicrobials and other medical needs, both to reduce consumption and hospital costs [32, 33]. Future directions for reducing antibiotic consumption and costs may be the use of natural compounds, prevention of infections associated with medical care, others [34-36].
Conclusion
Our findings are that of the first ten antibiotics more than 80% of antibiotics are prescribed and most of them belong to the Watch group. Despite a relatively low consumption of antibiotics in terms of number of doses, they are more expensive. The annual average cost of antibiotics in ICUs shows a positive trend, especially in recent years. Quantifying the antibiotic prescription provides valuable information for policymakers and is an important step in understanding the total economic impacts on the budget of the hospital and provides strategies to improve clinical outcomes and costs.
Acknowledgments: None
Conflict of interest: None
Financial support: University of Oradea
Ethics statement: None