Pharmacophore an International Research Journal
Prevalence of Stress and Its Association with Body Weight Among Medical Students in Taibah University
Anas Molowi Khalil1*, Norah Mubarak Almutairi2, Smaher Sultan Alhejaili2, Mawada Qabl Alsaedi2, Walaa Khalif Alharbi2
|
|
|
Abstract
Background and Objectives: Medical education is a well-known source of stress for medical students. It can affect their caloric intake leading to a change in their body weight. The current study aimed to decide the prevalence of stress among medical students and to observe the association between the level of stress, gender, and BMI among medical students at Taibah University, Medina. Aim of the study; To determine the prevalence of stress among medical students and to observe the association between the level of stress, gender, GPA, and BMI among medical students of Taibah University. Methods: A cross-sectional review was led at Taibah University that included all medical students from 2nd to 6th year. A perceived stress scale-10 questionnaire used to measure the stress score. Weight and height were collected based on self-reported value. Result: 257 of the students agreed take an interest in the review with a mean age of 21. 173 out of 257 were female students while 84 of them were male students. The prevalence of students with high stress was 23.3%. The higher level of stress was recorded among third-year female students however there was no statistically huge contrast amang gender. While the weight mass index (BMI) has been positively correlated with stress (p=0.010). Conclusion: Stress is prevalent between medical school students at Taibah University. We found a positive correlation between BMI and stress but no statistically significant association between gender and stress level. Preventive measures ought to be implanted to reduce the level of pressure between medical students.
Keywords: Stress, Body mass index, Medical students, Saudi Arabia, Taibah University.
Introduction
Stress is defined as a state of uncontrolled emotional changes caused by different stressors. It is characterized by nonspecific body reactions to disturbing situations in the surroundings [1] Different methods of medical, psychological, and psychotherapy treatments to reduce stress [2, 3] and to train coping skills are a major part of the process of effective exposure to stress [4, 5].
Studying medicine include demanding and complex courses over a long duration of time that made medical education a well-known source of stress to medical students [6]. Many research studies had revealed an alarmingly high prevalence rate between medical school college students worldwide [6-16]. In Malaysia, India, Egypt, and Iran, such studies concluded that prevalence rates of stress among undergraduate medical students were 56%, 51.3%, 62.4%, and 61.3% respectively [8-11]. In KSA, the prevalence rate ranged between 28% to 87% [3, 8-12]. It is well established that a high level of stress has a negative impact on both the physical and psychological wellness of medical students. It can put them at risk of mental illnesses and affect their learning and cognitive functions [6].
The relationship among stress and body weight has been investigated for many years. People alter their caloric intake during stressful events, some engage in negative binge eating in particular of carbohydrates and saturated fats, while others cut down their caloric intake during stressful events. These factors make people respond differently to stress, some gain weight while others lose weight [17, 18]. Different theories are explaining the pathophysiology of stress and its effect on body weight, but the exact reason is not fully understood. One of the suggested theories is the effect of stress on activation of the hypothalamic-pituitary-adrenal axis (HPA-axis) [17-19].
It is crucial to determine the effect of stress on medical students and how it may affect their health and professional career. No published review was directed in Madinah, KSA to look into the relationship a among stress and body weight among medical students.
Rationale
Studies had an alarmingly high prevalence rate of stress between medical students worldwide .as studying medicine includes demanding and complex courses over a long duration of time that made medical education a well-known source of stress to medical students
This study will decide the pervasiveness of worry between clinical understudies and watchthe relationship between the level of stress, gender, GPA, and BMI among medical students of Taibah University.
As there is no study in the literature about it at Taibah University. Thus investing in this topic well fulfills the researcher's aim.
Aim of the study
To determine the prevalence of stress among medical students and to observe the association between the level of stress, gender, GPA, and BMI among medical students of Taibah University.
Objectives:
The current study aimed to determine the prevalence of stress among medical students and to observe the association between the level of stress, gender, GPA, and BMI among medical students of Taibah University.
Methodology
Study design and setting:
A cross-sectional review was conducted at the College of Medicine at Taibah University, Medina.
Study setting:
This review was conducted on medical students at Taibah University.
Study population and sampling:
All medical students from the 2nd to 6th year were invited to participate. The estimated number of medical students at Taibah University is 708. The calculated study sample is 250(262 for 5% non-response rate) by using Epi Info with a confidence interval of 95% and an expected frequency of 50% and a confidence level of 5%.
Inclusions and Exclusions criteria:
Sample size:
The researcher has used 50%, moreover, based upon a confidence level 95% and margin of error of 5%. The sample size calculated using the Raosoft calculator be will 257 of the students approved to participate in the researchr
Sampling technique:
The researcher has used simple randomization between all the students who agreed to participate in the stud.
Has been contacted during the study duration between the students agreed to participate in the study to cover the sample size
Data collecting tools:
A stress score questionnaire (perceived stress scale-10) by Sheldon Cohen used to measure the stress level. It consists of 10 Likertlike scale questions and ranges from 0 to 4. The higher the score index, the higher the level of stress.
Height and weight data were collected from medical students based on their self-reported values. The Body Mass Index was calculated by using the equation weight/height (m2). Students considered underweight if BMI <18.5, normal if BMI<25, overweight if BMI ranged from 25-29.9 and obese if BMI more than or equal 30.
Data analysis:
For the data entry and statistical analysis, the statistical package for the social sciences (SPSS) version 22.0 was used. Appropriate statistical tests were used in the analysis based on the types and distribution of the study data. Categorical data were analyzed using the chi-square test while the t-test was used for numerical data. The results will be statistically significant if the P-value is <0.05.
Data Collection technique:
The researcher has been distributed the questionnaire personally to all medical students of Taibah University. After approval from higher authorities acquired, during the working hours, specifically between the break times. A short introduction about the research and its importance was presented. The response rate was high.
Study variables:
The variables: Body Mass index by using the equation weight/height (m2). Students considered underweight if BMI <18.5, normal if BMI<25, overweight if BMI ranged from 25-29.9 and obese if BMI more than or equal 30.
Data Entry and Analysis:
The researcher has used the statistical program for social sciences SPSS software 23.0 for data entry and analysis. Necessary statistical tests such as Chi-square T-test and other appropriate tests had been used. A p-value of less than 0.05 has been adopted for statistical significance.
Pilot Study/Pretesting:
The questionnaire has been applied to 10% of the sample size over the medical students
Ethical considerations:
1. Ethical approval obtained from the scientific research ethics committee at Taibah University.
2. Verbal informed consent was obtained from all participants after explaining to them the aim and nature of the study.
3. Privacy and confidentiality assured as the questionnaire filled anonymously.
Result
Table 1: Distribution of socio-demographic details of (n=257) Medical Students at Taibah University enrolled in this study.
|
N |
% |
|
|
Age |
||
|
<20 |
22 |
8.6 |
|
20-22 |
136 |
52.9 |
|
22-24 |
85 |
33.1 |
|
24 or more than |
14 |
5.4 |
|
Gender |
||
|
Female |
173 |
67.3 |
|
Male |
84 |
32.7 |
|
Marital status |
||
|
Single |
248 |
96.5 |
|
Married |
5 |
1.9 |
|
Other |
4 |
1.6 |
|
Income |
||
|
<5000 |
55 |
21.4 |
|
5000-10000 |
38 |
14.8 |
|
10000-15000 |
49 |
19.1 |
|
15000-20000 |
33 |
12.8 |
|
>20000 |
82 |
31.9 |
|
Educational level |
||
|
Second year |
65 |
25.3 |
|
Third year |
70 |
27.2 |
|
Fourth year |
58 |
22.6 |
|
Fifth year |
43 |
16.7 |
|
Sixth year |
21 |
8.2 |
|
BMI |
||
|
Underweight |
21 |
8.2 |
|
Normal weight |
134 |
52.1 |
|
Overweight |
63 |
24.5 |
|
Obese |
39 |
15.2 |
Out of these, 173 participants (67.3%) were females and 84 participants (32.7%) were males with average age of (20-22) were 52.9%
Table 2: Description of Stress groups according to the stress score.
|
N |
% |
|
|
Changed after starting medical school. |
||
|
Yes |
221 |
86.0 |
|
No |
36 |
14.0 |
|
If yes, the change was around: |
||
|
More |
136 |
61.5 |
|
Less |
84 |
38.0 |
|
I don’t know |
1 |
.5 |
|
Current GPA |
||
|
<2 |
2 |
.8 |
|
2 – 2.74 |
10 |
3.9 |
|
2.75 – 3.74 |
28 |
10.9 |
|
3.75 – 4.49 |
97 |
37.7 |
|
4.5 – 5 |
120 |
46.7 |
|
How much time do you spend studying per day? |
||
|
Less than 1 hour |
26 |
10.1 |
|
1 - 2 hour |
50 |
19.5 |
|
3 - 5 hour |
108 |
42.0 |
|
More than 5 |
73 |
28.4 |
|
The numbers of meal per day |
||
|
1 meal |
18 |
7.0 |
|
2 meals |
119 |
46.3 |
|
3 meals |
98 |
38.1 |
|
More than 3 |
22 |
8.6 |
|
Frequency of snacks between meals (chips, chocolate, sweets) |
||
|
Never |
2 |
.8 |
|
Always |
100 |
38.9 |
|
Sometimes |
117 |
45.5 |
|
Rarely |
38 |
14.8 |
|
Fast food per week |
||
|
Never |
28 |
10.9 |
|
1-3 |
183 |
71.2 |
|
4-7 |
39 |
15.2 |
|
More than 7 |
7 |
2.7 |
|
How often do you have stimulants (tea, coffee) in a week? |
||
|
Never |
36 |
14.0 |
|
1-3 |
55 |
21.4 |
|
4-7 |
40 |
15.6 |
|
More than 7 |
126 |
49.0 |
Regarding the change after starting medical school, most of participants answered yes (86.0%). The current GPA of the majority of participants (46.7%) was between 4.5–5 were constitutes. 45.5% of participants had snacks between meals (chips, chocolate, sweets). The majority of participants (71.2%) had 1-3 fast food per week. The majority of participants (49.0%) had stimulants (tea, coffee)more than 7 times in a week.
Table 3: Description the sample characteristics stratified by stress score
|
N |
% |
|
|
Exercise |
||
|
Yes |
227 |
88.3 |
|
No |
30 |
11.7 |
|
What is the total time that you spend in exercising daily? |
||
|
Less than 30 minutes |
181 |
79.7 |
|
30-40 minutes |
27 |
11.9 |
|
More than 50 minutes |
19 |
8.4 |
|
What time do you go to bed? |
||
|
8-10 pm |
12 |
4.7 |
|
11pm-12 am |
82 |
31.9 |
|
1-3 am |
133 |
51.8 |
|
After 3 am |
24 |
9.3 |
|
irregular |
6 |
2.3 |
|
Sleeping hours per day |
||
|
3 hours or less |
8 |
3.1 |
|
4-5 hours |
86 |
33.5 |
|
6-7 hours |
136 |
52.9 |
|
8 hours or more |
27 |
10.5 |
|
Trouble falling asleep |
||
|
Yes |
111 |
43.2 |
|
No |
146 |
56.8 |
|
Smoking Status |
||
|
Yes |
20 |
7.8 |
|
No |
237 |
92.2 |
|
How often do you smoke daily |
||
|
Up to 3 cigarettes |
5 |
25.0 |
|
3-10 cigarettes |
12 |
60.0 |
|
1 package or more |
3 |
15.0 |
|
You have been smoking for: |
||
|
Less than 1 year |
4 |
20.0 |
|
1 - 2 years |
10 |
50.0 |
|
More than 2 years |
6 |
30.0 |
|
Type of smoking |
||
|
Tobacco cigarettes |
15 |
75.0 |
|
Electronic cigarettes (Vaping) |
3 |
15.0 |
|
Shesha |
2 |
10.0 |
Regarding exercise, the majority of participants (88.3%) answered Yes, I play exercises. the majority of participants (79.7 %) exercised daily less than 30 minutes. Regarding smoking status, most of participants (92.2%) answered No I do not smoke. The most of participants (60.0%) answered they smoke cigarettes 3-10 times daily. 75.0% of participants smoked Tobacco cigarettes.
Table 4: Description of the sample characteristics stratified by Stress Scale.
|
|
Never |
Almost never |
Sometimes |
Fairly often |
Very often |
% of finding |
Chi-square |
||||||
|
N |
% |
N |
% |
N |
% |
N |
% |
N |
% |
X2 |
P-value |
||
|
How often have you been upset because of something that happened unexpectedly? |
19 |
7.4 |
21 |
8.2 |
99 |
38.5 |
69 |
26.8 |
49 |
19.1 |
60.51 |
88.623 |
<0.001* |
|
How often have you felt that you were unable to control the important things in your life? |
11 |
4.3 |
36 |
14.0 |
83 |
32.3 |
57 |
22.2 |
70 |
27.2 |
63.52 |
63.136 |
<0.001* |
|
How often have you felt nervous and “stressed”? |
7 |
2.7 |
13 |
5.1 |
80 |
31.1 |
69 |
26.8 |
88 |
34.2 |
71.21 |
115.043 |
<0.001* |
|
How often have you felt confident about your ability to handle your personal problems? |
7 |
2.7 |
44 |
17.1 |
118 |
45.9 |
64 |
24.9 |
24 |
9.3 |
55.25 |
143.409 |
<0.001* |
|
How often have you felt that things were going your way? |
10 |
3.9 |
58 |
22.6 |
124 |
48.2 |
53 |
20.6 |
12 |
4.7 |
49.90 |
166.988 |
<0.001* |
|
How often have you found that you could not cope with all the things that you had to do? |
13 |
5.1 |
49 |
19.1 |
97 |
37.7 |
61 |
23.7 |
37 |
14.4 |
55.84 |
75.082 |
<0.001* |
|
How often have you been able to control irritations in your life? |
9 |
3.5 |
51 |
19.8 |
124 |
48.2 |
63 |
24.5 |
10 |
3.9 |
51.36 |
173.486 |
<0.001* |
|
How often have you felt that you were on top of things? |
17 |
6.6 |
59 |
23.0 |
125 |
48.6 |
38 |
14.8 |
18 |
7.0 |
48.15 |
154.732 |
<0.001* |
|
How often have you been angered because of things that were outside of your control? |
9 |
3.5 |
37 |
14.4 |
78 |
30.4 |
81 |
31.5 |
52 |
20.2 |
62.65 |
69.829 |
<0.001* |
|
How often have you felt difficulties were piling up so high that you could not overcome them? |
12 |
4.7 |
50 |
19.5 |
100 |
38.9 |
54 |
21.0 |
41 |
16.0 |
56.03 |
78.428 |
<0.001* |
The relation between mean stress scores and sample characteristics stratified by Stress Scale was statistically significant (<0.001) in all items. The majority of participants answered “sometimes” in the stress scale.
Table 5: Description of the Stress Score Groups and Stress.
|
Stress |
|||||
|
N |
% |
Score |
|||
|
Range |
Mean±SD |
||||
|
Low Stress |
62 |
24.1 |
0-40 |
22.976±5.805 |
|
|
Moderate Stress |
169 |
65.8 |
|||
|
Severe Stress |
26 |
10.1 |
|||
|
Total |
257 |
100.0 |
|||
|
Chi-square |
X2 |
129.16 |
|||
|
P-value |
<0.001* |
||||
Regarding The association between the stress and stress score, most of the students (65.8%) had moderate stress followed by low stress (24.1%).
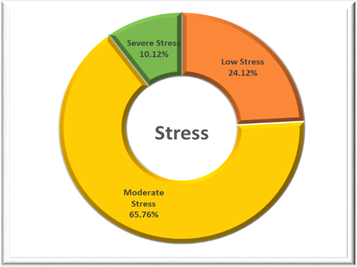
Figure 1: Description of the Stress Score Groups and Stress.
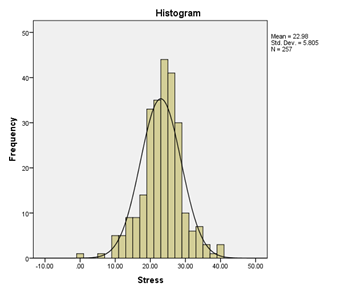
Figure 2: Histogram of Stress and frequency.
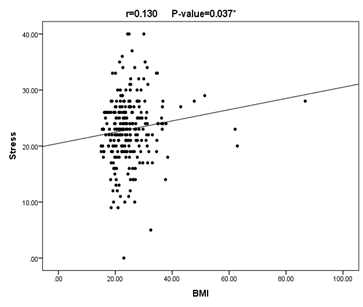
Figure 3: Correlation between BMI and stress level
Table 6: Distribute of the relation between the stress and demographic data (age, gender, Marital status, Income, Level of education, change after starting medical school, current GPA, and time spent for studying per day).
|
Items |
N |
Stress |
f or t |
ANOVA or T-test |
||||
|
Mean |
± |
SD |
test value |
P-value |
||||
|
Age |
<20 |
22 |
22.8182 |
± |
6.53661 |
f |
0.654 |
0.581 |
|
20-22 |
136 |
23.2794 |
± |
6.01442 |
||||
|
22-24 |
85 |
22.3412 |
± |
5.10264 |
||||
|
24 or more than |
14 |
24.1429 |
± |
6.75798 |
||||
|
Gender |
Female |
173 |
23.3526 |
± |
5.93937 |
t |
1.493 |
0.137 |
|
Male |
84 |
22.2024 |
± |
5.47234 |
||||
|
Marital status |
Single |
248 |
22.9355 |
± |
5.78808 |
f |
0.921 |
0.399 |
|
Married |
5 |
22.0000 |
± |
1.87083 |
||||
|
Other |
4 |
26.7500 |
± |
9.60469 |
||||
|
Income |
<5000 |
55 |
23.2727 |
± |
6.33758 |
f |
0.124 |
0.974 |
|
5000-10000 |
38 |
22.7632 |
± |
6.01994 |
||||
|
10000-15000 |
49 |
22.9796 |
± |
6.12199 |
||||
|
15000-20000 |
33 |
23.3636 |
± |
5.73268 |
||||
|
>20000 |
82 |
22.7195 |
± |
5.27111 |
||||
|
Educational level |
Second-year |
65 |
23.5231 |
± |
6.82850 |
f |
0.826 |
0.509 |
|
Third-year |
70 |
23.1714 |
± |
5.62595 |
||||
|
Fourth-year |
58 |
23.3448 |
± |
4.72229 |
||||
|
Fifth-year |
43 |
21.6977 |
± |
5.14335 |
||||
|
Sixth-year |
21 |
22.2381 |
± |
6.94913 |
||||
|
Changed after starting medical school. |
Yes |
221 |
23.3032 |
± |
5.93552 |
t |
2.252 |
0.025* |
|
No |
36 |
20.9722 |
± |
4.50071 |
||||
|
Current GPA |
<2 |
2 |
17.5000 |
± |
10.60660 |
f |
1.156 |
0.331 |
|
2 – 2.74 |
10 |
20.9000 |
± |
6.27960 |
||||
|
2.75 – 3.74 |
28 |
23.2500 |
± |
6.32821 |
||||
|
3.75 – 4.49 |
97 |
22.5670 |
± |
5.27555 |
||||
|
4.5 – 5 |
120 |
23.5083 |
± |
5.97754 |
||||
|
How much time do you spend studying per day? |
Less than 1 hour |
26 |
22.8462 |
± |
7.01252 |
f |
1.621 |
0.185 |
|
1 - 2 hour |
50 |
22.5600 |
± |
4.93286 |
||||
|
3 - 5 hour |
108 |
22.3611 |
± |
5.36248 |
||||
|
More than 5 |
73 |
24.2192 |
± |
6.41882 |
||||
Stress scores and change after starting medical school are shown. The mean stress score was highest among those who answered yes (23.3) while it was lowest among those who reported No (20.9). This study showed a significant association between change after starting medical school and stress (p value=0.025). The mean stress score was highest among those who reported the highest GPA of 4.5-5 (23.51) while it was lowest among those who reported the lowest GPA of < 2 (17.5). This study a significant association between BMI and stress (p value=0.010). Other variables that did not a significant association with stress level were age, gender, marital status, income, educational level, the time spent studying per day with P-value=0.001.
Table (7): The relation between stress and sample characteristics stratified by stress score.
|
Items |
N |
Stress |
f or t |
ANOVA or T-test |
||||
|
Mean |
± |
SD |
test value |
P-value |
||||
|
The numbers of meal per day |
1 meal |
18 |
22.7778 |
± |
5.57891 |
f |
1.471 |
0.223 |
|
2 meals |
119 |
22.7647 |
± |
5.97836 |
||||
|
3 meals |
98 |
22.7143 |
± |
5.71127 |
||||
|
More than 3 |
22 |
25.4545 |
± |
5.20739 |
||||
|
Frequency of snacks between meals (chips, chocolate, sweets) |
Never |
2 |
31.0000 |
± |
1.41421 |
f |
1.731 |
0.161 |
|
Always |
100 |
23.1400 |
± |
6.37391 |
||||
|
Sometimes |
117 |
22.4957 |
± |
5.50489 |
||||
|
Rarely |
38 |
23.6053 |
± |
4.97311 |
||||
|
Fast food per week |
Never |
28 |
23.2857 |
± |
5.54348 |
f |
1.759 |
0.156 |
|
1-3 |
183 |
23.0601 |
± |
5.06243 |
||||
|
4-7 |
39 |
21.6667 |
± |
8.36136 |
||||
|
More than 7 |
7 |
26.8571 |
± |
7.08116 |
||||
|
How often do you have stimulants (tea, coffee) in a week? |
Never |
36 |
23.3333 |
± |
5.46678 |
f |
0.957 |
0.414 |
|
1-3 |
55 |
21.9636 |
± |
5.80537 |
||||
|
4-7 |
40 |
22.5500 |
± |
6.25095 |
||||
|
More than 7 |
126 |
23.4524 |
± |
5.75584 |
||||
|
Exercise |
Yes |
227 |
22.9075 |
± |
5.96341 |
t |
-0.525 |
0.600 |
|
No |
30 |
23.5000 |
± |
4.47792 |
||||
|
What is the total time that you spend in exercising daily? |
Less than 30 minutes |
181 |
23.1713 |
± |
6.02573 |
f |
0.926 |
0.398 |
|
30-40 minutes |
27 |
21.6296 |
± |
4.82898 |
||||
|
More than 50 minutes |
19 |
22.2105 |
± |
6.78707 |
||||
|
What time do you go to bed? |
8-10 pm |
12 |
22.1667 |
± |
6.39365 |
f |
0.732 |
0.571 |
|
11pm-12 am |
82 |
22.9390 |
± |
5.19104 |
||||
|
1-3 am |
133 |
22.7068 |
± |
5.98202 |
||||
|
After 3 am |
24 |
24.4583 |
± |
6.63966 |
||||
|
irregular |
6 |
25.1667 |
± |
5.63619 |
||||
|
Sleeping hours per day |
3 hours or less |
8 |
26.1250 |
± |
9.10945 |
f |
1.472 |
0.223 |
|
4-5 hours |
86 |
23.3721 |
± |
6.36913 |
||||
|
6-7 hours |
136 |
22.8162 |
± |
5.11527 |
||||
|
8 hours or more |
27 |
21.5926 |
± |
5.94371 |
||||
|
Trouble falling asleep |
Yes |
111 |
23.7207 |
± |
6.58672 |
t |
1.738 |
0.084 |
|
No |
146 |
22.4110 |
± |
5.08367 |
||||
|
Smoking Status |
Yes |
20 |
23.0500 |
± |
7.18533 |
t |
0.048 |
0.962 |
|
No |
237 |
22.9705 |
± |
5.69225 |
||||
p-value>0.001 was considered statistically significant.
Discussion
This study was conducted to assess the prevalence of stress among medical students and to observe its association with body weight. Both stress and unhealthy body weight can cause major psychological and physical health issues that will have bad impacts on students [7]. This study have significant association among BMI and stress (P-value =0.010) (figure 3), which is in agreement with other studies done in Jizan, KSA (P-value= 0.001) [15] and Egypt (P-value =0.001) [10]. Most of the respondents were female; they accounted for 173 students (67.3%) (Table 1). The perceived prevalence of stressed students who scored 27 or more in the stress score was 23.3%. The prevalence of stress in this study was lower than the ones from Malaysia (48.6%) [20], Dammam (71.7%) [21], Jizan (71.9), and United Kingdom (31.2%) [15] but higher than a Swedish study (12.9%) [21]. A prior study done in Taibah university recommended the continuous supervision of students by their academic supervisors and to dissolve any barriers between the students and staff by strengthening the bonds and trust between them and minimize the stressful environment at the college of medicine [1]. This study a significant association between the sample characteristics stratified and stress scale with P-value <0.001) (Table 4). In 2014, the College of Medicine at Taibah University started a new curriculum that implemented these recommendations, which might have helped in decreasing the stress among medical students. Regarding the association among the stress and stress score, most of the students (65.8%) had moderate stress followed by low stress (24.1%). The average stress score was higher in females (23.35) than males (22.2) (table 6). This discrepancy between male and female students could be attributed to many factors besides their psychological and physiological differences; females have fewer learning opportunities, poor educational services, and lesser recreational activities compared to the male students. This is similar to a study done in Jizan University reported that the prevalence of stress was higher among females (76.9%) than males (63.7%) [15]. There is no significant association between GPA and stress level (P-value=0.331) (Table 6), which is similar to findings from other universities in Saudi Arabia and Pakistan [22].
Conclusion
In this study, we found that the prevalence of stress in Taibah University was less than in other universities with no significant difference between males and females. There was a mild association between BMI and stress. It is recommended to reduce the stress level among the student by implementing different preventive strategies.
Acknowledgment:
We would like to thank the staff of the medical college of Taibah University for allowing us to conduct this study. We also would like to thank our supervisor for his support and expert guidance.
References