Pharmacophore an International Research Journal
SERUM SCLEROSTIN LEVEL: A NOVEL BIOMARKER FOR CORONARY HEART DISEASE IN T2DM IRAQI PATIENTS
Ruaa Ali Mohammed Ali1, Rasha Shaker Nima2*
|
|
|
ABSTRACT
Background: The specific action of sclerostin, is as an antagonistic ligand, for the Wnt LRP5/6 co-receptors. The current study aimed to estimate the circulating sclerostin levels as coronary heart disease novel biomarker in Iraqi individuals with type 2 diabetes (T2DM). The present study included 300 types 2 diabetic patients; 150 of them had coronary heart diseases (T2DM-CHD), and the remaining 150 diabetic patients (T2DM) served as a pathological control group. Receiver operating characteristics (ROC) curve analysis was used to determine the usefulness of sclerostin and BNP as markers for coronary heart disease in T2DM patients. Serum sclerostin level in T2DM-CHD was significantly higher when compared with the T2DM group (181.357±10.959 versus 154.285±12.377 P<0.0001). Also, serum BNP level was significantly higher in T2DM-CHD compared with age-gender match T2DM patients (230.456±92.588 versus 162.317±57.528 P<0.0001). The concentration of serum sclerostin >163.636pg/ml showed a sensitivity of 94% and specificity of 99% to identify coronary heart disease risk in T2DM patients. While the concentration of serum BNP >199.327pg/ml showed a sensitivity of 61.2% and specificity of 99.8% to identify the risk of CHD in T2DM patients. The data highlighted the fact that serum sclerostin may be a better biomarker than BNP in T2DM-CHD subjects.
Keywords: Serum Sclerostin, T2DM, Coronary heart diseases
Introduction
Type 2 diabetes (T2DM) is a dominant metabolic syndrome [1]. The phenotypical characteristic is hyperglycemia arising from insufficient insulin secretion or insulin resistance [2]. Patients with T2DM are at high risk of coronary artery diseases (CHD) [3]. With the grave consequences of morbidity and mortality. Several types of investigation have affirmed that many factors consist of enhanced autonomic neuropathy, endothelial dysfunction, coagulability, and oxidative stress and are usually present in T2D patients, which may be directly involved to the development of CHD [4, 5]. The wingless-integrated pathway (Wnt) is classified into calcium-dependent pathways, Wnt-planar cell polarity, and canonical Wnt-β-catenin. Wnt-β-catenin pathway role has been already mentioned in skeletal development [6], glucose and lipid metabolisms [7], cardiovascular homeostasis [8], and adipocyte differentiation [9]. In health and disease, Wnt proteins can affect several cell types concerned in the cardiovascular system.
Moreover, lots of components participate in the propagation and initiation signaling pathway of Wnt-β-catenin [10]. A Wnt ligand binds to the single-pass low-density lipoprotein receptor-related protein 5 or 6 (LRP5/6) and the seven-pass transmembrane receptor Frizzled [11]. Sclerostin is a monomeric glycoprotein with 190 amino acids. In humans, the SOST gene encodes sclerostin. Osteocytes are the main source of sclerostin, and kidney, liver, and vascular wall cells also secrete it. Sclerostin acts as an antagonistic ligand for the Wnt LRP5/6 co-receptors [12]. The apparent relation between sclerostin, and arterial wall calcification and cardiovascular events is uncertain. The correlation between arterial calcification and sclerostin is controversial [13]. Therefore, this study aimed at evaluating the circulating sclerostin levels as coronary heart disease novel biomarker in Iraqi individuals with T2DM.
Methods
Study Design
Three hundred Iraqi patients (150 Women, 150 Men) aged 56.7 ±1.64 years participated in this study 150 T2DM patients with CHD (T2DM-CHD), and 150 were T2DM patients without CHD (T2DM). The T2DM-CHD patients were selected from patients in the catheterization ward of Najaf Center for Cardiac Surgery, at Al-Sadder Medical City, Najaf, Iraq (with stenosis of more than 70% in each of the main coronary vessels or T2DM patients who had been admitted for myocardial infarctions). Besides, 30 healthy aged-matched subjects (15 females, and 15 males) were included as the control group. The protocol of the study was approved by the College of Science in Kufa University Ethics Committee. Also, each subject signed an informed approval before participating in the study. Written informed consent was obtained from all participants. All patients were Iraqi, without connective tissue diseases, congenital heart disease, cardiomyopathy, severe liver, or kidney disease. Patients with vasculitis and familial hypercholesterolemia were also excluded.
Clinical assessment
Baseline information concerning medical history, treatment procedures, utilization of medications, event characteristics, and demographics were collected and documented on the electronic case report forms. Body weight and height were measured to the nearest 0.1 using a stadiometer. The body mass index (BMI) was calculated according to the Quetelet formula (weight in kg divided by the square of the height in meters). With the stretch-resistant tape parallel to the floor, waist circumference was measured at the midpoint between the top of the iliac crest and the lower margin of the last palpable rib. Hip circumference was measured twice around the widest portion of the buttock, and the average was calculated.
Biochemical analysis
Blood samples were taken at the same time of the day, for all subjects and after 12-hour fasting. Samples were collected in two tubes. The first was left to allow clot formation for 10 min, then centrifuged for 20 min at 3000 Xg, and sera were separated. The reminder samples were collected in the tubes containing K2EDTA for the measurement of glycated hemoglobin percentage (HbA1C). The percentage of Hemoglobin A1c was measured by a colorimetric method by using the HbA1c kit (Stanbio, USA). The glucose oxidase method (Biomaghrab, France) was used to determine fasting blood glucose was determined by the glucose oxidase method (Biomaghrab, France). Total cholesterol (TC) was evaluated by a single reagent, COD-PAP method (Elabscience, USA). High-density lipoprotein–cholesterol (HDL-C) was determined by a single reagent, PEG-CHO-PAP method (Elabscience, USA). Besides, Triglyceride (TG) was analyzed by a single reagent, GPO-PAP method (Elabscience, USA). While, low-density lipoprotein-cholesterol (LDL-c), was calculated by using the Friedewalds equation. Very low-density lipoprotein-cholesterol (VLDL-C) was calculated TG (mmol/L)/2.2. Serum insulin, serum sclerostin, and serum B-type Natriuretic Peptide (BNP) levels were determined using various solid-phase ELIZA kits (Elabscience, USA).
Statistical analysis
Data of the present study are expressed as mean ± standard deviation (Mean ± SD). The parameters of the 2 groups were compared using the student's t-test. Serum sclerostin and BNP usefulness as markers of a high risk of coronary heart disease in patients with T2DM were analyzed using a receiver operating characteristic (ROC) curve. All statistical analyses were carried out using the SPSS software (V20;0 IBM, Armonk, NY. USA). A calculated probability (p-value) of less than 0.05 was considered significant. In addition, HOMA2 calculator was downloaded from Oxford University that used to calculate beta-cell function, insulin resistance, and insulin sensitivity.
Results and Discussion:
The current study included 300 T2D patients; 150 of them had coronary heart diseases, and the remaining 150 diabetic patients served as a pathological control group. In addition to 30 age-matched healthy control. Anthropometric measurements of the investigated individuals were stated in Table 1. It shows no significant differences between the two studied groups in all essential characteristics (all P<0.05).
Table 1. Basic Characteristics of type 2 diabetic patients with and without coronary heart diseases.
|
Parameters |
Group 1 T2DM - CHD |
Group 2 T2DM |
P-value |
|
Number (Control;30) |
150 |
150 |
0.895 |
|
Gender (Men / Women) (Control;15/15) |
75/75 |
75/75 |
0.948 |
|
Age (Years) (Control; 56.400±5.800) |
56.617± 8.128 |
57.167± 7.764 |
0.549 |
|
BMI (Kg/m2) (control; 25.834±5.407) |
30.063± 5.216 |
29.969±1.996 |
0.829 |
|
Waist circumference (cm) (control;95.100±10.222) |
109.417±15.326 |
109.117±11.616 |
0.849 |
|
Hip circumference (cm) (control;94.300±10.574) |
100.383±18.119 |
100.733±11.373 |
0.955 |
|
Waist / Hip ratio (control;1.026±0.197) |
1.111±0.210 |
1.089±0.102 |
0.249 |
The biochemical data of the enrolled patients and controls were presented in Table 2. It points out significant differences in HbA1c, IN, HOMA-%S, HOMA-IR, HOMA-%β, TC, TG, HDL-C, LDL-C, and VLDL in the T2DM-CHD Group concerning to T2DM group. There were no significant difference in FBG and HDL-C (Table 2).
Table 2. Biochemical data of type 2 diabetics with and without coronary heart diseases and normal control.
|
Parameters |
Group 1 T2DM - CHD |
Group 2 T2DM |
P-value |
|
HbA1c (%) (control;5.530±0.702) |
9.381± 1.445 |
7.373±1.779 |
0.0001 |
|
FBG (mg/dl) (control; 102.6± 0.197) |
241.390± 79.586 |
253.048±92.963 |
0.243 |
|
IN (µU/ml ) (control; 5.530±0.702) |
36.539± 8.566 |
27.672± 9.519 |
0.0001 |
|
HOMA-%S (control; 123.100± 20.470) |
29.242±12.45 |
48.13± 16.470 |
0.0001 |
|
HOMA-%β (control; 92.100± 32.470) |
47.098±10.32 |
44.038 ±12.45 |
0.0212 |
|
HOMA-IR (control; 0.825± 0.882) |
11.111 ±3.617 |
6.668 ±2.901 |
0.0001 |
|
TC (mg/dl) (control; 167.84± 26.73) |
237.666 ±50.365 |
194.318±49.547 |
0.0001 |
|
TG (mg/dl) (control; 111.87± 45.72) |
190.233±35.791 |
100.433±42.089 |
0.0001 |
|
HDL-C (mg/dl) (control; 56.29± 10.3) |
41.033±7.012 |
40.1000 ±7.720 |
0.274 |
|
LDL-C (mg/dl) (control; 100.5± 25.51) |
237.667 ±70.969 |
214.4000±76.174 |
0.006 |
|
VLDL (mg/dl) (control; 21.602± 6.931) |
37.933±7.068 |
31.927±8.749 |
0.0001 |
The results in Table 3 indicate that the differences in the ratios of TC/HDL-C, TG/HDL-C, and LDL-C/HDL-C in group 1 (T2DM-CHD) were significantly higher than in group (T2DM).
Table 3: Lipoprotein ratios of type 2 diabetics with and without coronary heart diseases and normal control.
|
Parameters |
Group 1 T2DM - CHD |
Group 2 T2DM |
P Value |
|
TC/HDL-C (control; 3.532± 0.583) |
6.962 ±3.521 |
5.641±.989 |
0.0001 |
|
TG/HDL-C (control; o.637± 0.213) |
7.188 ±5.877 |
2.652 ±1.086 |
0.0001 |
|
LDL-C/HDL-C (control; 1.842± 1.93) |
5.218±2.744 |
2.889± 1.271 |
0.0001 |
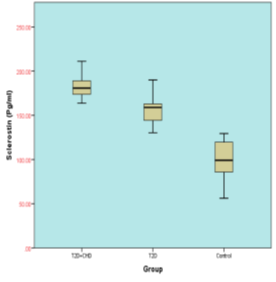
Figure 1 shows the levels of serum sclerostin and serum brain natriuretic peptide for subjects included in this study. Table 4 points out that the serum sclerostin level significantly increased in T2DM-CHD compared with age-gender match T2DM without CHD patients (181.357±10.959 versus 154.285±12.377, respectively; P<0.0001). Also, Serum BNP level was significantly higher in T2DM-CHD compared with age-gender match T2DM patients (230.456±92.588 versus 162.317±57.528, respectively; P<0.0001).
 |
 |
|
A |
B |
Figure 1: Box plots display A-Serum sclerostin levels (pg/ml) and B - serum BNP levels (pg/ml) in study population.
Table 4: Comparison of different Serum Sclerostin levels and Serum brain natriuretic peptide levels of subjects.
|
Parameters |
Group 1 T2DM with CHD |
Group 2 T2DM |
P-value |
|
S. Sclerostin (pg/ml) (Control; 97.899± 24.032) |
181.357±10.959 |
154.285±12.377 |
0.0001 |
|
S. BNP (pg/ml) (Control; 86.793± 8.452) |
230.456±92.588 |
162.317±57.528 |
0.0001 |
Receiver operating characteristics (ROC) curve analysis was performed to evaluate the usefulness of sclerostin and BNP as markers for coronary heart disease in T2DM patients. The results showed an area under the curves of sclerostin and BNP (0.904, P<0.0001for sclerostin, and 0.723, P<0.0001) (Figure 2). The serum sclerostin concentration of >163.636 pg/ml showed a sensitivity of 94% and specificity of 99% to identify the risk of coronary heart disease in T2DM patients. On the other hand, the concentration of serum BNP >199.327 pg/ml showed a sensitivity of 61.2% and specificity of 99.8% to identify the risk of coronary heart disease in T2DM patients (Table 5).
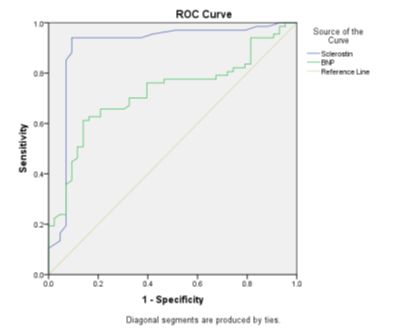
Figure 2: Receiver operating characteristics (ROC) curve for Sclerostin and BNP to predict T2DM-CHD.
Table 5. Receiver operating characteristics (ROC) curve to predict CHD in T2DM.
|
Parameters |
AUC |
SD |
P Value |
95% CI |
Cut off value |
Sensitivity% |
Specificity% |
|
|
Lower Bound |
Upper Bound |
|||||||
|
Sclerostin |
0.904 |
0.037 |
0.0001 |
0.831 |
0.977 |
163.636 |
94 |
99.07 |
|
BNP |
0.723 |
0.049 |
0.0001 |
0.628 |
0.818 |
199.327 |
61.2 |
99.86 |
According to the literature, there is a firm relation between CHD and T2DM. The progression of arteriosclerotic takes place earlier, and to a greater extent in the T2DM than in the non-T2DM subjects. In patients with T2DM, the diagnosis of arterial diseases does not always precede the development of an acute arterial incident. Several factors contribute to the presence of CHD in T2DM patients, and only 25% of these have previously been noted [14]. Hence, it is necessary to investigate the relevant affecting factors, which purpose such high hazard. Yet it is not clear whether the fluctuations in the levels of blood glucose and increased insulin secretion or insulin resistance that is responsible for the association between CHD and T2DM. Physicians would like to recognize this information to aid them to predict and prevent CHD in T2DM patients. In consideration of that, CHD risk factors may differ between individuals and community and by sex and age [15].
In the current study, HbA1c, IN, HOMA-%S, HOMA-IR, and HOMA-%β levels were significantly higher in T2DM-CHD patients than those in T2DM patients. This data suggests that HbA1c, fasting insulin, insulin resistance, or reduced insulin secretion are better predictors of future coronary heart disease than fasting glucose. Also, insulin resistance might be the primary mechanism linking T2DM to CHD. Previous observational investigations have consistently reported a positive relation between HbA1c and CHD risk, although they are susceptible to confounding [16]. To explain the association between CHD risk and chronically increased level of blood glucose, several biological mechanisms have been suggested [17]. One of the explanations, glucose can interact with various kinds of proteins, creating advanced glycation products, which take part in long-term diabetes complications, as well as to endothelial dysfunction, changes in arterial distensibility, plaque formation, and atherosclerosis [18]. The data pointed to the presence of a reduction in the levels of HOMA-%S, and HOMA-% β in T2DM- CHD patients as in T2DM patients. This can be interpreted by the fact that insulin signaling governs the metabolism of glucose and lipids in the heart. Therefore, insulin resistance creates a metabolic disrupts, that consequences in low glucose oxidation and high lipid oxidation. That can cause endoplasmic reticulum stress, mitochondrial dysfunction, and oxidative stress. This can result in irregular handling of calcium ion and low generation of ATP, leading to the death of cardiomyocytes [19].
The data show that dyslipidemia is highly prevalent in T2DM-CHD patients. Though the patients included in this study received oral hypoglycemic agents and lipid-lowering agents in some cases, a significant proportion of them had abnormal lipid profiles. Each of the dyslipidemic features has participated in the risk of coronary heart disease. There was not any significant difference in the mean level of HDL-C between the two groups. Concerning the traditional plasma fasting lipid profile, though several consensus documents have been published, there is no universal acceptance of how this information should be interpreted and used [20, 21]. Previous studies point out that dyslipidemia is a very frequently metabolic abnormality, including both qualitative and quantitative changes in serum levels of lipoprotein [22]. The key features of dyslipidemia include high total cholesterol, high triglycerides, elevated low-density lipoprotein, and decreased high-density lipoprotein [23]. Actually, our study has established that lipoprotein ratios were significantly related to coronary artery lesions in T2DM patients. Atherogenic indices or lipoprotein ratios that are obtained from these lipid indicators have been shown by several epidemiological studies as better indicators than any single lipid parameter of CHD [24, 25]. One of the best things about these ratios is that they as quickly as they can be calculated by the physician and are easier to comprehend at the clinical level.
Furthermore, these ratios capable of providing a reference on risk factors hard to estimate by routine analysis and could be a better mirror of the clinical metabolic interactions and between lipid fractions. Since the ratios of lipoprotein are underused in cardiovascular prevention but can be added to the assessment of risk. Most recently, the close connection between lipoprotein ratios and the severity of stenosis of the coronary artery was stated [26, 27]. Yang, et al. in their study suggested that the lesions of coronary artery were relevant to the abnormal metabolism of lipid. In the meantime, the ratios of LDL-C/HDL-C and TC/HDL-C were better shows than other lipid parameters [28]. After that, Momiyama, et al. stated that LDL-C/HDL-C was connected to coronary atherosclerosis severity [29].
Regardless of higher serum BNP levels and CHD risk in T2DM in Iraqi patients. These data pointed to the presence of a complex interaction among immunological components and neurohormonal in the regulation of cardiac endocrine response that including natriuretic peptide synthesis and secretion. Altered BNP receptors expression might participate in resistance to the biological effect of the peptides in CHD [30, 31].
On the other hand, serum sclerostin level was significantly higher (P<0.001) in T2DM-CHD patients than T2DM patients. Both in vitro and in vivo, canonical Wnt signaling pathway activation is involved in VSMCs proliferation in the arterial and venous [32]. Moreover, the Wnt pathway has been mentioned to have a vital role in the endothelial inflammation regulation, calcification of vascular and differentiation of mesenchymal stem cell [33]. According to evidence, the atherosclerosis process is both progressive and actively regulated, so we can suggest that high levels of serum sclerostin could be a pointer of a kind of defensive mechanism that may weaken the canonical Wnt pathway upregulation and produce the return of calm Wnt signaling seen in a normal situation and preventing the progression of atherosclerotic [34].
The coronary artery circulation plays an essential role in matching blood delivery to the myocardial metabolic needs, which consists of resistance and conductance vessels. The cell layer that lines these blood vessels is the endothelium layer. This layer helps to maintain the tone of the blood vessel, and acts as a barrier to toxic materials, and regulates hemostasis and inflammation [35]. Endothelial cells arise from mesodermal cells differentiation that producing crude vascular structures called blood islands. Vascular endothelial growth factor induces the newly formed endothelial cells to migrate on a matrix permit fusion of the blood islands, the formation of the first primitive vascular plexus, and their remodeling into tubular structures [36]. In the same way, Oranger et al. viewed the role of sclerostin in angiogenic activity and inducing proangiogenic cytokines vascular endothelial growth factor [37].
Conclusion:
By comparing the diagnostic value for T2DM-CHD of serum sclerostin and BNP levels in T2DM patients by ROC curves, the results showed that similar to BNP, serum sclerostin may be a novel biomarker for the diagnosis of patients with CHD in T2DM. Therefore, the data highlighted the fact that serum sclerostin may be a better biomarker than BNP in T2DM-CHD subjects.
References