Pharmacophore an International Research Journal
Is There Any Association Between Osteoporosis and Adiponectin Gene Polymorphism (Rs2241766t>G) In T2dm Postmenopausal Women?
Safa Thaer Flayyih Ali1, Hamdullah Hadi Al-Baseesee2, Rasha Shaker Nima3*
|
|
|
ABSTRACT
Background: Osteoporosis and fragility fractures incur substantial global morbidity and mortality. Adiponectin is made exclusively by adipocytes. Objectives: To study the association of rs2241766t>G SNP in the adiponectin gene with osteoporosis in T2DM postmenopausal women. Methods: This cross-sectional study was carried out with 200 postmenopausal Iraqi women, 160 T2DM women, and 40 aged match women as healthy control. T2DM patients were divided into two groups concerning their femoral neck T-score of bone mineral density (BMD). The osteoporotic (T2DM-OSO) group has consisted of 80 T2DM postmenopausal women with T-score smaller than -2.5 SD, and the non-osteoporotic T2DM women (T2DM) group consisted of 80 T2DM postmenopausal women with T-score bigger than -1 SD. Serum adiponectin concentrations and genotyping of rs2241766t>G SNP in the adiponectin gene were determined. Results: The biochemical data pointed out significant differences in HOMA-S %, HOMA-IR%, and HOMA-β % in the T2DM-OSO group concerning those of the T2DM group, genotyping results of selected adiponectin gene polymorphism rs2241766 was associated with incident T2DM-OSO. Additionally, there was a significant association of the (TG+GG) genotype with a lower adiponectin level. Conclusion: This study demonstrated that BMD is affected by adiponectin that may be as a result of genetic variation in populations. Serum adiponectin and its genotype may be correlated with BMD, which may have an application for assessing the susceptibility to osteoporosis in type 2 diabetic postmenopausal women clinically.
Keywords: Type 2 diabetes, osteoporosis, adiponectin gene, and Genotyping of rs2241766T>G SNP.
Introduction
Osteoporosis is a complex polygenic disease. It is represented by bone tissue microarchitecture deterioration and reduced bone mass [1-3]. That driving to strength loss and fractures risk increased [4-6]. The causes of osteoporosis are genetic, environmental factors, and the interactions between them. Clinically osteoporosis is determined via the measurement of BMD [7]. Also, more than 20% of bone loss can happen during the postmenopausal stage. There are various mechanisms by which T2DM can impact the bone [8]. Studies have indicated that osteoporosis and fractures may be more prevalent in patients with T2DM than can be expected by chance [9].
Adiponectin in the human is encoded by the adiponectin gene. It is 17 kb and located in chromosome 3q27, Adiponectin gene contains three exons, which start codon in exon two and stop codon in exon three [10]. The chromosome 3q27 in the human has been pointed out as a susceptibility gene for T2DM disease [11]. Serum adiponectin has attracted prevalent interest in its vital role in energy homeostasis and glucose metabolism [12]. Serum adiponectin and adiponectin receptor are demonstrated to be expressed in osteoblast cells, indicating that adiponectin might impact the metabolism of bone. Various biochemical researches have shown that adiponectin is negatively correlated with BMD, and positively with bone turnover biochemical markers [13]. So, in the present study, we examined the genetic associations of adiponectin in T2DM with the risk of osteoporosis in postmenopausal women in Iraq.
Methods
Study Design
This cross-sectional study was carried out with 200 postmenopausal Iraqi women. Eligible women for this study were postmenopausal for more than one year. Participants, including 160 T2DM women and 40 aged match women as healthy control. Diagnosis of type 2 diabetes was made according to the American Diabetes Association criteria. T2DM women were separated into two groups for their T-score of BMD. The osteoporotic (T2DM-OSO) group has consisted of 80 T2DM postmenopausal women with T-score smaller than -2.5 SD, and the non-osteoporotic T2DM women (T2DM) group has consisted of 80 T2DM postmenopausal women with T-score bigger than -1SD [1]. The study protocol was approved by the College of Science University of Kufa Ethics Committee. All the females were Iraqi, without connective tissue diseases, congenital heart disease, cardiomyopathy, severe liver, or kidney disease. Patients with vasculitis and familial hypercholesterolemia were also excluded. Informed signed consent was taken from all participants during blood sampling.
Bone Mineral Density Assessment
Bone Mineral Density (gm/cm3) at the left femoral neck was measured using dual-energy X-ray absorptiometry (DEXA). All DEXA scans were performed by the same trained staff. The femoral neck device was calibrated daily. The coefficient of variability (CV) values of the DEXA measurements of the femoral neck was 0.7% [14].
Biochemical Analysis
Blood samples were taken at the same time of the day (8:00 to 10:00) AM, for all subjects and after 12- hour fasting. Samples were collected in two tubes. The first was left to allow clot formation for 10 min, then centrifuged within 20 min at 3000 Xg, and sera were separated. The reminder samples were collected in the tubes containing K2EDTA for the measurement percentage of glycated hemoglobin (HbA1C). The percentage of Hemoglobin A1c was measured by a colorimetric method by using the HbA1c kit (Stanbio, USA). Fasting blood glucose was determined by the glucose oxidase method (Biomaghrab, France). Serum insulin, adiponectin, was determined using an ELISA method (Demeditec, Germany).
Genotyping analysis
The genomic DNA extraction kit (Geneaid, Germany) was used to extract genomic DNA from the peripheral blood concerning manufactures guidelines. Genotyping for the studied SNP was accomplished using polymerase chain reaction-restriction fragment length polymorphism (PCR- RFLP). The primer sequences of rs2241766T>G SNP were present in table 1, and the restriction enzyme name and length of the restriction fragments were presented in table 2.
Table 1: Primer sequence for rs2241766T>G SNP in adiponectin gene [15].
|
SNP in Adiponectin gene |
Primer sequence (5 to 3) |
Tm |
|
rs2241766T>G |
Forward primer:5׳-GCAGCTCCTAGAAGTAGACTCTGCTG-3׳ |
58.2°C |
|
Reverse primer:5׳-GGAGGTCTGTGATGAAAGAGGCC-3׳ |
59.8°C |
Table 2: Restriction enzyme name and length of the restriction fragments.
|
SNP in Adiponectin gene |
Restriction enzymes |
Cut Temperatures |
Amplification Length (bp) |
Restriction fragments (bp) |
|
rs2241766T>G |
SmaI |
37 C0 |
372 |
372, 209 and 163 |
Statistical Analysis
Data of the present study are denoting as mean ± standard deviation (Mean ± SD). Generally, all statistical analyses were carried out SPSS software (V20; 0 IBM Corporation, Armonk, NY. the USA). A calculated probability (p-value) less than 0.05 was considered significant. In addition to that, the HOMA2 calculator was downloaded from the University of Oxford that used to calculate beta-cell function, insulin resistance, and insulin sensitivity.
Results and Discussion
The essential characteristics of including women are denoted in Table 3. There were no statistically significant differences (p<0.05) in number, age, duration of diabetes, and body mass index. At the same time, BMI and T-score values were considered significantly low in the T2DM-OSO group.
Table 3: Essential characteristics of the study participants
|
Parameters |
Group 1 T2DM - OSO |
Group 2 T2DM |
P Value |
|
Number(Control;40) |
80 |
80 |
0.89 |
|
Age (Years)(Control; 54 ± 7.326) |
58.619±11.133 |
61.5833±6.934 |
0.4929 |
|
BMI(Kg/m2)(control;28.734±3.407) |
31.063± 5.216 |
30.969±1.996 |
0.8805 |
|
T-score(Control; 0.216 ± 0.966) |
-3.7 ± 0.956 |
0.443 ± 1.08745 |
0.0001 |
|
Duration of diabetes (Years) |
5.624 ± 1.437 |
6.071 ± 2.193 |
0.630 |
Data are means ± SD, T2DM: Type 2 diabetes mellitus, BMI is body mass index. T-Score is describing BMD.
The biochemical data of the enrolled patients and controls were presented in Table 4. It points out significant differences (P<0.05) in HOMA-S %, HOMA-IR%, and HOMA-β %, among the two compared T2DM groups. However, no significant difference was observed in FBG (P=0.3859), HbA1C (P= 0.4640), and insulin concentration (P= 0.7303).
Table 4: Biochemical Data of Type 2 Diabetic Woman with and without Osteoporosis
|
Parameters |
Group 1 T2DM - OSO |
Group 2 T2DM |
P Value |
|
FBG(mg/dl)(control; 95.364± 10.823) |
226.1 ± 115.641 |
241.389 ± 106.62 |
0.3859 |
|
HbA1c (%)(control;5.530±0.702) |
9.238 ± 2.044 |
8.519 ± 8.519 |
0.4640 |
|
IN (µU/ml )(control; 5.530±0.702) |
31.943 ± 5.786 |
32.2907± 6.902 |
0.7303 |
|
HOMA -S%(control;92.100± 20.470) |
29.242±12.45 |
48.13± 16.470 |
0.0001 |
|
HOMA-β%(control;134.457±30.805) |
30.013 ± 18.766 |
40.405 ± 22.265 |
0.0017 |
|
HOMA –IR%(control; 0.825± 0.882) |
19.8875 ± 4.920 |
11.395 ± 2.734 |
0.0001 |
Data are means ± SD, N: Number, FBG: Fasting blood glucose, HbA1c (%): Hemoglobin A1c, IN insulin, HOMA-IR: Homoeostasis model assessment- insulin resistance. HOMA-S %, HOMA-β%.
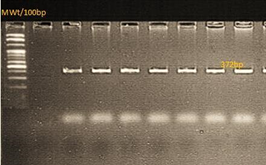
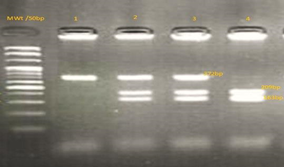
The adiponectin gene was amplified for the detection of rs2241766T>G SNP in the two groups of diabetic patients. The amplicon size of the amplification product was 372bp. The products of digestion were analyzed by agarose gel electrophoresis. Women have the wild type of homozygote (TT) gene displayed 372bp only. Those of heterozygote (TG) type showed three bands with sizes of 372bp, 209bp, and 163bp. While Those of the homozygote (GG) type yielded two fragments of 209bp and 163bp sizes (Figure 1).
|
A-
|
B-
|
Figure 1: A-PCR product of SNP (rs2241766T>G) in the adiponectin gene was analyzed by 1.5% agarose gel electrophoresis. B- Restriction enzyme products analyzed by (1.5%) agarose gel electrophoresis.
Lane (1): 372bp uncut fragment.
Lanes (2 and 3): 372bp,209bp, and 163bp.
Lanes ( 4): 209bp and 163bp sizes.
The genotyping and allele frequencies of the studied polymorphisms in T2DM patients are seen in table 5. Data indicated no significant difference between the observed and expected genotypes. The genotyping results of the studied SNP were found to be consistent with Hardy-Weinberg equilibrium.
Table 5: Hardy-Weinberg equilibrium analysis of rs2241766T>G SNP in the adiponectin gene
|
Gene |
Genotype Number |
P(value) |
|||
|
Adiponectin (rs2241766T>G) |
Values |
TT |
TG |
GG |
|
|
Observed |
74 |
66 |
20 |
0.683 |
|
|
Expected |
71.556 |
70.887 |
17.554 |
||
To evaluate the gene-disease associations for the investigated SNP in the adiponectin gene, different inheritance models were considered. The selection of the most appropriate model was achieved via the estimation of the odds ratio. The statistical analysis of the genotype distribution of studied SNP under various inheritance models significant differences under co-dominant and recessive models, when the data of T2DM-OSO and T2DM groups were compared. Allele association of rs865429 SNP was analyzed for the relevance with the risk of development of osteoporosis in the diabetic woman. The Results indicated a frequency of the T allele of 77.5% and 56.25% and the G allele of 22.5% and 43.75% in T2DM-OSO and T2DM groups respectively with significant difference (Table 6).
Table 6: Association of rs2241766T>G Genotype with Osteoporosis under Different Inheritance Models
|
Model |
Genotype |
Frequency % |
Odd ratio (CI 95%) |
P-value |
|
|
T2DM-OSO (80) |
T2DM (80) |
||||
|
Co-dominant |
TT |
51 |
23 |
4.4348 2.1801 to 9.0214 |
0.0001 |
|
TG |
22 |
44 |
|||
|
GG |
7 |
13 |
4.118 1.4520 to 11.6791 |
||
|
Dominant |
TT+TG |
73 |
67 |
2.0235 0.7618 to 5.3745 |
0.157 |
|
GG |
7 |
13 |
|||
|
Recessive |
TT |
51 |
23 |
4.358 2.241 to 8.475 |
0.0001 |
|
TG+GG |
29 |
57 |
|||
|
Allele |
T |
77.5 |
56.25 |
0.0001 |
|
|
G |
22.5 |
43.75 |
|||
The biochemical characteristics of patients with T2DM-OSO were analyzed in relevance to the genotype of the selected SNP under the recessive model. For the rs2241766T>G in the adiponectin gene, the recessive model included patients with genotypes TT+TG vs GG. The analysis was carried out by the student's t-test. The analyses of the data of the indicated significant elevations (P=0.0001) of adiponectin level and a significant decrease in T-score value as in Table 7.
Table 7: Differences of T- score and adiponectin level in relevance to the genotypes of adiponectin rs2241766T>G in T2DM-OSO patients under the recessive model
|
Parameters |
TT (23) |
TG +GG (57) |
P-value |
|
T-score |
-0.802 ± 0.045 |
-0.033 ± 0.006 |
0.0001 |
|
Adiponectin level (ng/ml) |
6.839 ± 1.539 |
4.729 ± 0.938 |
0.0001 |
Sex steroid hormone-depleted state is menopause, in which the likelihood of hormone-responsive disease in tissues like the cardiovascular system, brain, and bone increases [16]. This gives on to compromised life quality. Menopause stat is related to the gain weight in a large number of women. Over-weight or obesity mostly leads to increased metabolic syndrome prevalence in postmenopausal women [17-19]. The coexistence of obesity and insulin resistance, specifically visceral adiposity, is so harmful to metabolic health. As well as it is correlated with prothrombotic processes and inflammatory, also alterations in postmenopausal adipocytokine production [20]. Otherwise, a cross-regulation complex system exists connecting adipose tissue adipokine and bone metabolism. Adipose tissue adipokine regulates the activities of the bone cell, whereas osteocalcin (bone-derived protein) triggers adiponectin expression [21]. It is quite well determined that T2DM and osteoporosis are common diseases in postmenopausal women with notably connected with the risk of morbidity and mortality [22]. Therefore, the assessment of adiponectin may be beneficial. The data of our study showed a significant association between adiponectin level and osteoporosis in T2DM postmenopausal women. Also, the results from previous studies to determinate the relationship between the adiponectin levels and BMD in elderly men [23], patients with type 2 diabetes [24], healthy postmenopausal women [25], and postmenopausal women with type 2 diabetes revealed that there is a significant correlation between adiponectin and BMD [26], similar to our findings. Though very few researches have determined the link between single nucleotide polymorphism on the adiponectin gene with serum levels of adiponectin in osteoporosis, the results of the current study, indicate that the concentration of adiponectin, a hormone which is secreted from adipose tissue, is inversely correlated with T2DM-OSO risk. While the genotyping results of rs2241766 revealed an association with T2DM-OSO in postmenopausal women. A significant difference was found in alleles and genotype frequencies between T2DM-OSO and T2DM in terms of the selected SNP. We, therefore, assume that the effect of a single gene variant on T2DM-OSO will be strong. The effect of SNPs and haplotypes adiponectin gene on normal BMD variation in healthy Japanese women and men explored by Otsuka et al., [27]. They reported no significant within-family association between each SNP in the adiponectin gene and peak BMD [28], investigated the correlation between single nucleotide polymorphisms in the adiponectin gene and BMD. Their findings revealed an association between rs2241766T>G and femoral neck BMD in Korean women. Also, results of previous studies on other adipokines polymorphism such as leptin demonstrated their correlation with BMD, which is in consisted with our findings; however, there were uncertain outcomes about this area under discussion [29].
Conclusion
The results of the present study highlighted BMD which is affected by adiponectin that may be a result of genetic variation in populations. Serum adiponectin and its genotype may be correlated with BMD that may have had an application for assessing the susceptibility to osteoporosis in type 2 diabetic postmenopausal women, clinically.
References