Pharmacophore an International Research Journal
WATER QUALITY AND SPATIAL ASSESSMENT OF PHYSICOCHEMICAL PARAMETERS
Delia Nica-Badea1*, Tiberiu Tataru1
|
|
|
ABSTRACT
The study's goal was to evaluate the Jiu River's potential for having high-quality water while taking into account the typical values of the physico-chemical parameters. We created the water purity class from an ecological point of view using components and national physic-chemical quality criteria based on the 18 physic-chemical characteristics found in three sample stations. With the exception of P-PO4 class IV for all three water segments, the majority of metrics fall into quality class I; TP (class III, IV, III); N-NO2 (class II, III, III). The 8 metrics' WQI values change depending on the segment under study: Excellent (DO, BOD, Nitrate, Phosphates, pH); Good (TDS; BOD-SJ3); Bad (Temperature); and Very Bad (Turbidity) are the other parameters. In summarizing the findings, it can be said that the overall WQI's quality index changes very little. 79, 78, and 77, all of good quality, are deteriorating near the Jiu River's southern branch in Gorj County. WQI value decrease continues on Dolj County respectively: 67, 64, and 63 in the direction of flow to the Danube River. This may be explained by taking into consideration the human stresses that the watercourse is subjected to from major, intermittent, and dispersed sources on the territory of two nations.
Keywords: Middle Jiu, Water quality parameters, Ecological status, Water quality index
Introduction
Global water quality has declined rapidly over the past decade, under the synergistic impact of natural and anthropogenic factors [1, 2]. Water is a vital natural resource for sustaining life, a key factor in ensuring human health [3, 4]. Watercourses are being monitored and assessed at the regional, national, and European levels as a result of the necessity of water conservation [5, 6]. One of the most crucial concerns in the management of water resources today is water quality. evaluating the quality of water for different uses. An vital tactic for ensuring food safety, preserving and boosting human health, and bolstering the world economy is domestic, irrigation, conservation, and industry [7].
Physical, chemical, and biological factors are the three main categories that can be used to categorise water quality in general terms. In accordance with national law [8], Five main categories of indicators were created for the characterization and evaluation of water quality: acidification and thermal regime: temperature (T) and the quantity of hydrogen ions (pH); oxygen regime: dissolved oxygen (DO), biochemical oxygen demand (BOD), chemical oxygen demand (COD); nutrients: ammonia (N-NH4), nitrites (N-NO2), nitrates (N-NO3), total nitrogen (TN), phosphates (P-PO4), total phosphorus (TP), Chlorophyll a (Chl a); salinity: conductivity (EC), filterable residue (TDS), chloride (Cl-), sulphates (SO42-), sodium (Na+), calcium (Ca2+), magnesium (Mg2+); specific toxic pollutants of natural origin total chromium (Cr), copper(Cu), zinc (Zn), arsenic (As), barium (Ba), selenium (Se), cobalt (Co), lead (Pb), cadmium (Cd), iron (Fe), mercury (Hg), manganese (Mn) and nickel (Ni); other relevant chemical indicators.
Five quality classes for rivers have been established to categorise water bodies' ecological status in accordance with national regulations by Order No. 161 on the classification of surface waters [8]: high ecological status (Class I), coded blue; good ecological status (Class II), coded green; moderate ecological status (Class III), coded yellow; poor ecological status (Class IV), coded orange; and bad status (Class V), coded red. The maximum value of the parameters for each quality class is the acceptable value for that class.
Since 1965, the Water Quality Index (WQI) has been suggested to describe the water quality in a river [9], and since 1970, the proposed WQI models have been based on the weight of a number of different characteristics that are taken into consideration [10-14].
The main differences between these methods are the way the sub-index is calculated, the significance of the parameter values, and the character of the subdomains that can be linearly segmented and nonlinear segmented.
According to environmental indicators, Romania's surface water body ranged between being moderate (45%) and high (55%) in 2018 [15]. The Jiu River is the main watercourse that crosses the territory of Gorj County, along with the major rivers that have upper basins in the high mountain area, have large average annual flows, provide natural water supply, or act as sources of water supply for towns and rural settlements.
The Jiu Water Basin Administration of the Romanian Waters Agency routinely evaluates the water quality in the Gorj Rivers. The analysis of water quality parameters has been extensively studied [16, 17], but only the Dolj County sector of WQI assessment studies has been reported [18, 19], which will be a term of continuity and reporting for our study. This study's objective was to assess the potential for Jiu River-Gorj Country's water quality by considering the average values of each quality parameter recorded at three monitoring stations, an assessment of the ecological status, and a range of water quality indicators.
Materials and Methods
The hydrographic basin of the Jiu River studied in this paper occupies an area of 10,080 km2 (approximately 4.2% of the country's surface).
A total of 232 tributaries totaling 3,876 km in length and 0.34 km/km2 in density make up the hydrographic network [20]. Many different types of landforms, including mountains, hills, plains, and marshes that are dispersed across large regions and whose altitude diminishes from north to south, have been formed as a result of geological composition and climatic conditions [20].
Passing through such landforms and a variety of urban agglomerations and agro-industrial centers, this body of water has been subjected to significant anthropogenic pressures. Related to the Water Framework Directive, depending on how the water body functions, the size of the environmental impact on the water body can be assessed [21, 22].
In this regard, Table 1 displays the measured amounts of organic compounds (expressed in CCO-Cr and CBO5) and nutrients (total nitrogen and total phosphorus) in 2016 for the Jiu River basin by categories of sources of pollution.
Depending on the kind of company and the amount of pretreatment applied to the industrial water before it is released into the sewage system, industrial wastewater and wastewater from urban sources may contain identical contaminants [23].
Table 1. Discharges of organic substances and nutrients in the Jiu River basin
|
Source type |
(CCO-Cr) |
(CBO5) |
N total |
P total |
|
t/year |
t/year |
t/year |
t/year |
|
|
Human agglomerations |
9290.751 |
4036.241 |
2069.006 |
888.50 |
|
Industrial and agricultural |
14246.760 |
3226.346 |
47.684 |
38.84 |
|
Total |
23536.511 |
7262.587 |
2116.690 |
927.54 |
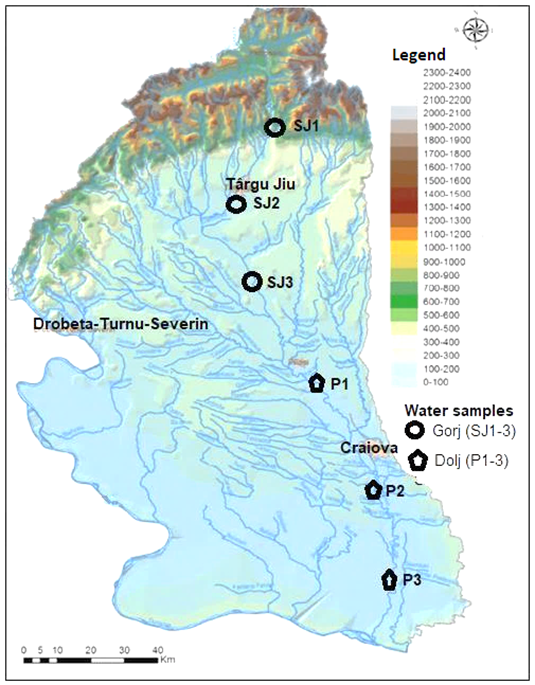
The selection of the sampling points took into account the methodology in force and the location of significant points regarding the discharge of untreated wastewater on the 139 km segment in the Jiu River on the Territory of Gorj County. Jiu sample 1 (JS1), Jiu sample 2 (JS2), and Jiu locality Bâlteni (SJ3) were established as the three gathering points for water samples from the Jiu River section relating to Gorj county in the first phase of the water quality evaluation study.
Using the most recent standards for internal river and stream sampling methodologies, water samples were collected in polyethylene containers about 30 cm below the water's surface during the autumn of 2018 and transported to a lab at 4 °C for storage [24-26]. In situ measurements were carried out to identify unstable factors such as temperature, pH, conductivity, and dissolved oxygen. Using high-purity chemical materials and reagents, the analysis of the chosen physicochemical parameters was carried out in accordance with national standard procedures that were recognized internationally (SR ISO, SR EN). Determinations were done using the standard technique: thermometric (T); potentiometric (pH, EC); Turbidimetric (Turb); standard reflux dichromate method (CODCr); incubation, Winkler titration (BOD); titrimetric (DO, Cl-, TN); gravimetric (TDS); UV-VIS spectrophotometry (N-NH4, N-NO2, N-NO3, P-PO4, TP, Phl, MBAS); photometer - turbidimetric method (SO42-).
When determining the Jiu River's water quality index (WQI) and evaluating the water body's condition with respect to national requirements (Order 161/2006), the parameters developed at the laboratory Archive Water Management System Gorj were utilized as indicators. The formula/model for the water quality index (1) was utilized for this inquiry [10]:
|
WQI=1100 qi.w |
(1) |
i is the quality parameter, qi is the assigned value, and wi is the assumed rank of the parameter's contribution to the computation formula.
In the context of applying the model/formula (1) WQI index includes the following steps: 1) selected water quality parameters: water temperature, pH, turbidity, dissolved oxygen five days, biochemical oxygen demand, PO43- , NO3- , total phosphorus; 2) for each of the parameters - i - obtained, the Qi values are determined from the Q-value diagram according to that parameter; 3) Qi value is multiplied by the weight factor Wi which signifies the contribution attributed to each parameter to the total water quality and thus the quality index is obtained. The Field Manual for Water Quality Monitoring [10] states that the NSF Water Quality Index calculation was done online.
Results and Discussion
The outcomes of the physicochemical parametric analysis shown in tab 2 can serve as the database for evaluating the quality class that surface waters employed in determining the ecological standing of H2O bodies (Order 161/2006); for calculating the water quality index and water quality status [10].
Table 2. Physico-chemical indicators for Jiu River, Gorj County
|
Indicator |
UM |
Analysis method |
Sampling section |
||
|
SJ1 |
SJ2 |
SJ3 |
|||
|
Turbidity |
(mg/L) |
SR 27888 /1997 |
33.0 |
21.0 |
21.0 |
|
T |
(º C) |
SR EN1622:2007 |
17.00 |
19.00 |
25.00 |
|
DO |
(mgO2/L) |
SR EN 1899 -2 / 2002 |
9/1 |
11.0 |
7,9 |
|
Oxygen saturation |
(%) |
- |
97.0 |
98.3 |
97.4 |
|
BOD5 |
(mg/L) |
DIN 38409 /1992 |
1.3 |
1.8 |
2.0 |
|
COD -Cr |
(mg/L) |
DIN 38409 /1992 |
7/93 |
7.45 |
9.47 |
|
TDS |
(mg/L)/ |
STAS 9187/1984 |
125.2 |
151.3 |
136.0 |
|
pH at 21.1⁰C |
(u pH) |
SR ISO 10523/2012 |
7.07 |
7.81 |
7.74 |
|
N-NH4+ |
mg N/L |
SR ISO 71501/2001 |
0.086 |
0.03 |
0.033 |
|
N-NO2 - |
(mgN/L) |
SR EN 26777 / 2002 |
0.0270 |
0.035 |
0.0380 |
|
N-NO3 - |
(mg N/L) |
SR ISO 7890-3/2000 |
0.620 |
0.65 |
0.950 |
|
TN |
(mg/L) |
SR ISO/119051:2003 |
0.81 |
1.02 |
1.26 |
|
P - PO4 3- |
(mg P/L) |
SR EN ISO 6878/2005 |
0.050 |
0.079 |
0.052 |
|
TP |
(mg/L) |
SR EN ISO6878/2005 |
0.055 |
0.082 |
0.059 |
|
Chlorides |
(mg/L) |
SR ISO 9297/2001 |
7.445 |
12.508 |
7.643 |
|
Sulfates |
(mg/L) |
EPA 375.4:2005 |
19.27 |
23.14 |
34.59 |
|
Detergents (MBAS) |
(mg/L) |
SR EN 903/2003 |
<0.1 |
<0.1 |
<0.1 |
|
Phenols |
(mg/L) |
SR ISO 6439/2001 |
<0.003 |
0 |
<0.003 |
We conducted an objective comparison of the special quality variables for the three sampling areas (SJ1, SJ2, and SJ3) and the ecological quality class in accordance with elements, chemical, and physical measures of quality in freshwater quality (Table 3), in order to evaluate the water quality of the Jiu River on the Gorj segment.
Table 3. Ecological water quality classes for Jiu River were reported to National Standards (Order 161/2006).
|
Indicator |
Standard classes of Waters Quality |
Quality class Jiu |
||||||
|
I |
II |
III |
IV |
V |
SJ1 |
SJ2 |
SJ3 |
|
|
T (0C) |
No norms |
|
|
|
||||
|
pH (u pH) |
6.5-8.5 |
|
|
|
||||
|
DO (mg/L) |
9 |
7 |
5 |
4 |
<4 |
I |
I |
I |
|
DO % |
90-70 |
70-50 |
50-30 |
30-10 |
<10 |
I |
I |
I |
|
BOD (mg/L) |
3 |
5 |
7 |
20 |
>20 |
I |
I |
I |
|
COD (mg/L) |
10 |
25 |
50 |
125 |
>125 |
I |
I |
I |
|
N-NH4 + (mg/L) |
0.4 |
0.8 |
1.2 |
3.2 |
>3.2 |
I |
I |
I |
|
N-NO2 (mg/L) |
0.01 |
0.03 |
0.06 |
0.3 |
>0.3 |
II |
III |
III |
|
N-NO3 (mg/L) |
1 |
3 |
5.6 |
11.2 |
>11.2 |
I |
I |
I |
|
T N (mg/L) |
1.5 |
7 |
12 |
16 |
>16 |
I |
I |
I |
|
P-PO4 (mg/L) |
0.01 |
0.02 |
0.04 |
0.19 |
>0.19 |
IV |
IV |
IV |
|
T P (mg/L) |
0.015 |
0.04 |
0.075 |
1.2 |
>1.2 |
III |
IV |
III |
|
TDS (mg/L) |
500 |
750 |
1000 |
1300 |
>1300 |
I |
I |
I |
|
Cl- (mg/L) |
25 |
50 |
250 |
200 |
>300 |
I |
I |
I |
|
SO4 2- (mg/L) |
60 |
120 |
250 |
300 |
>300 |
I |
I |
I |
|
Turbidity |
- |
|
|
|
||||
|
MBAS æg/L |
100 |
200 |
300 |
500 |
>500 |
I |
I |
I |
|
Fenols æg/L |
1 |
5 |
20 |
50 |
>50 |
I |
I |
I |
Thermal Regime and Acidifying
The temperature of bodies of water as well as the variety of aquatic life have a direct impact on the amount of dissolved oxygen, the processes of chemical and biological substances, stratification, and density. It has been noted that the Jiu River's water temperature has increased. between 17 oC at point SJ1 and approximately 25 oC at point SJ3. The mountain area (upstream Sadu) experiences this increase specifically during the autumn days before moving through the Targu-Jiu Municipality and into the plains (Bâlteni).
The water's pH, measuring the amount of hydrogen ions, has values that are neutral or barely essential and tumble in the parameters of the quality standards I (6.5–8.5). They vary from 7.07 at the entryway to Sadu (SJ1) to a highest of 7.81 downriver of the municipality of Targu-Jiu (SJ2) to 7.74 at the southernmost section of the area under study (SJ3). The possible effects of domestic and industrial wastewater in the locations through which it travels provide justification for this variety. The existence of the lignite quarrying sector and the operation of lignite power plants characterize the southern area (SJ3) (Rovinari, Turceni).
Oxygen Regime
It has been demonstrated that factors such as water temperature, photosynthetic activity, river energy sources, and pollution sources affect the daily and annual regime of soluble gases dissolved in river waters. The oxygen regime quality class's three measures were examined:
Segment SJ3 has an essential value of 7.9 mg/L, which is greater than what is allowed for quality class II (7 mg/L), whereas segments SJ1 and SJ2 have dissolved oxygen (DO) lowest levels of 9.1 mg/L and 11.0 mg/L, respectively, which are greater than what is allowed for ecological quality class I (9 mg/L). This shows the minimal ecological quality loss when moving through an environment with anthropogenic impacts and the established link between DO levels and water temperature in the literature [18]. Between 97% and 98.3%, the parameter saturation in oxygen levels in water of class I quality (90–110) falls into the following ranges: Epilimnion stratified the water.
Between 1.3 and 2.1 mg/L, which is what is deemed to be in ecological quality class I (3 mg/L), there is an increase in levels, according to the indicator's (BOD5) norms, from the northern portion of the entrance section (SJ1) to the southern part (SJ3). This indicates a decrease in the amount and capability of organic compound biochemical breakdown in water on the river segment from north to south, within the same class. A high BOD5 level may signify pollution with human-made wastewater as well as a high concentration of organic carbon originating from natural sources. The values of these indicators rise as a result of the increased amounts of organic substances produced by plants throughout their vegetative season, as well as during periods of intense precipitation that enable the transportation of extra amounts of organic matter.
Taking into account the maximum COD value for class I (10 mg / L) there is a slight increase of this parameter towards the SJ3 area (9.47 mg/L) but below the limit value of Class I.
Nutrients
The nutrient assessment was focused on highlighting the level of NH4+; N-NO3-; N-NO2-; TN and P-PO4-3; TP. Despite being low in toxicity, their presence in water might be used as a sign of anthropogenic pollution.
Ammonium ions may be present in natural water as a result of organic materials decomposing anaerobically, in the presence of bacteria, or as a result of decreases in nitrite ions [4]. Analyzing the NH4+ level, there is a decrease in concentration from 0.086 at the point of exit from the mountain area to 0.033 in the southern area. All values are well below the maximum quality class I limit (0.4). Depending on the pH and industrial activities, in the water, there may be ammonium ions or free ammonia (NH3) which is 50 times more toxic than the form NH4 + [18].
Nitrate level demonstrations increment from SJ1 (0.620 mg / L) to SJ3 (0.950 mg / L), values that fall below the maximum level of quality class I (1mg / L).
Nitrites occur during the normal cycle of decomposition of organic substances, usually in late summer and autumn, which would be plausible given the sampling period. Rising values towards the southern part of the river segment analyzed also show the level of nitrogen 0.0270 mg / L (SJ1) at 0.0380 mg / L (SJ3), classifies the water of this river in quality class II respectively III for SJ2 and SJ3. This can be argued by the fact that the nitrite ion (NO2-) is the result of the process by which bacteria transform ammonium ions into nitrite ions or by reducing anaerobic conditions and partially eliminating wastewater when the level rises to tenths of a milligram. Nitrite ion levels may indicate fecal contamination of the water. It was found experimentally in the reports in the literature that the level of nitrite ions is lower than that of nitrate ions, a fact confirmed in this study: the order of magnitude for nitrites is 10 times lower than that of nitrates for water in Jiu.
The increasing variance in the direction of water flow is the same in TN and ranges from 0.81 mg/L for SJ1 to 1.26 mg/L for SJ2, falling under the quality class I limit of 1.5 mg/L. Between analysis sections, there may be sewage discharges (Targu-Jiu, Rovinari) or wastewater from animal farms (Bumbești-Jiu) due to the increased fluctuation of these parameters in the direction of flow.
P-PO4 concentrations fluctuate sinusoidally, reaching a maximum at 0.079 mg/L downstream of Targu-Jiu (SJ2) and putting the entire region in quality class IV for all three segments. Similar patterns can be seen in the parameter Total P, which reaches its peak downstream of Targu-Jiu (SJ2) at 0.082 mg/L, class IV (max. 1.2 mg/L), and class III for SJ1 and SJ3 at 0.0752 mg/L, respectively. The inappropriate storage of animal manure and the usage of phosphate fertilisers are typically to blame for the increase in phosphorus concentration.
Salinity
The overall concentration of suspended materials reflects the salinity regime. Winter is typically when maximum values occur, and fall is when they occur less frequently.
Because the two accumulation dams in the Targu-Jiu municipality region, which might alter the level of this parameter, are downstream of the water sample collection location at SJ2, the TDS distribution displays a sinusoidal oscillation, with a maximum at SJ2 (151.3 mg/L). According to the amount of fixed residue present in the water body, erosion is taking place there at a comparatively rapid rate. The measured chloride content also exhibits sinusoidal oscillation, reaching a high at SJ2 of 7.12 mg/L, significantly below the maximum value of quality class I (25 mg/L).
Sulfate concentrations are on an upward trend in the flow direction from SJ1 to SJ3 (19.27 to 34.59 mg / L), values well below the maximum limit for quality class I (60 mg / L).
According to the Field Manual for Water Quality Monitoring's (Formula 1), the Jiu River's water quality index is calculated using the physical-chemical and biological parameters that were selected from Table 2: Temperature, turbidimetry, and total solids are examples of physical parameters; pH, total phosphate, nitrates, and total phosphate are examples of chemical parameters; and oxygen saturation (%) and BOD are examples of biological parameters. The results of the calculating software are applied [10]. Each parameter of the three sampling areas' water quality is assessed using the range quality and overall water quality index (WQI), which are depicted in Table 4 and Figure 2. We can see how the Jiu River's water quality changes along the segment that has been investigated in Gorj County thanks to the particular results of the quality index (WQI) that were gained for each chosen variable as well as the general results (summative) for the three collection stations of water samples.
Table 4. Water quality evaluation based on WQI calculated for the Jiu River, Gorj County
|
Indicator |
Weight factor |
Value JS1 |
WQI SJ1 |
Value SJ2 |
WQI SJ2 |
Value SJ3 |
WQI SJ3 |
|
DO % |
0.17 |
97 |
99 |
98.3 |
99 |
97.4 |
99 |
|
pH (u pH) |
0.11 |
7.07 |
89 |
7.81 |
90 |
7.74 |
91 |
|
BOD5 (mg/L) |
0.11 |
1,3 |
92 |
1.8 |
84 |
2.0 |
80 |
|
Temperature (º C) |
0.10 |
17.00 |
27 |
19.00 |
24 |
25.00 |
16 |
|
Phosphate (mg/L) |
0.10 |
0.050 |
98 |
0.079 |
97 |
0.052 |
98 |
|
Nitrates (mg/L) |
0.10 |
0.62 |
96 |
0.65 |
96 |
0.95 |
96 |
|
Turbidity (NTU) |
0.08 |
99 |
18 |
63 |
32 |
63 |
32 |
|
Total Solids (mg/L) |
0.07 |
125.2 |
81 |
151.3 |
79 |
136.0 |
80 |
|
Overall WQI |
|
|
79 |
|
78 |
|
77 |
|
Range Quality a |
|
|
Good |
|
Good |
|
Good |
aRange Quality: 90-100 Excellent; 70-89 Good; 50-69 Medium; 25-49 Bad; 0-24 Very bad (Oram 2010).
|
|
|
Figure 1. Location of sampling sections: Gorj County; Dolj County [19] |
The three analysis points SJ1-SJ3 show the following value distribution for the individual values of the estimated WQI for the chosen parameters: a) Equal or near Total Phosphate (98, 97, 98: Excellent); DO (99 Excellent); Nitrate (96 Excellent); pH (89, 90, 91: Excellent); Turbidity (18, 32, 32: terrible, Very terrible); b) Rising Temperature (27, 24, 16: extremely Bad); BOD (92, 84, 80: Excellent, Good); decreasing A total of solids (81, 79, 80: Good).
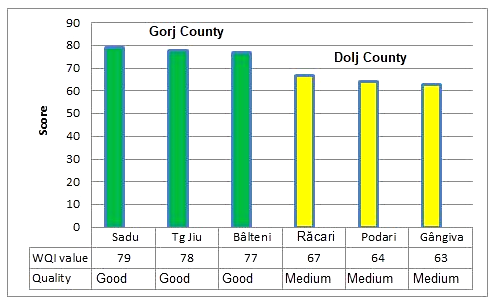
From the Jiu's point of exit and entry into Gorj County's territory upstream of the river Sadu's confluence (SJ1:79), downstream from the municipality of Targu-Jiu (SJ2:78), and finally, downstream from the terminal point of Bâlteni Locality (SJ3: 77), the general WQI differs very slight (Range Quality: Good).
A new paper [19] that attempts to analyze 3 places of WQI—Răcari (P1: 67.67), Podari (P2: 64.27), and Gângiova (P3: 63.19)—confirms the diminishing variation of the Middle Jiu's H2O quality in the territory of Dolj County (Figure 2).
|
|
|
Figure 2. Values of the Water Quality Index in the analyzed section |
Given the human pressures that the Jiu River is subjected to from substantial intermittent and scattered sources on the territory of the two counties, it is plausible to assume that its water quality is steadily degrading in the direction that it flows. The Jiu Water Basin Administration's Table 1 summarizes the situation of anthropogenic pressures on water resources in the Jiu River basin through sources of urban pollution and human agglomerations, industrial and agricultural pollution, and discharges of organic substances and nutrients (CCO-Cr, CBO5, N total, and P total). The Jiu River is a water body of good to medium quality, according to the evaluation of water body quality defined in recent literature. This fact has been validated by the national authority for monitoring and controlling water quality.
Conclusion
By determining 18 quality criteria at three collecting stations along the flow direction from the entrance to Gorj—upstream of the confluence with the Sadu River, downstream of Targu-Jiu municipality, and in the Bâlteni locality—it was possible to assess the Jiu River's quality status. In this study, point and diffuse sources of pollution from urban/human agglomerations/localities, as well as industrial and agricultural pollutants, have all had an impact on the physicochemical characteristics of water.
Thus, based on the determined values of the physicochemical parameters reported to the normative 161/2006 on the classification of surface waters to determine the ecological status of water bodies, it is highlighted that several parameters classify Jiu River on the territory of Gorj county in category I, with except for 3 parameters: P-PO4 class IV for all; TP (class III, IV, III); N-NO2 (class II, III, III) which indicates primarily an anthropogenic contribution of improper storage of animal waste and the use of phosphate fertilizers.
The ability to compare a water body over time and space is made possible by the calculation of the WQI water quality index, which also sets the quality class for each parameter or overall and the water usage capacity for various places or uses. The Overall WQI estimated for the Jiu River in Gorj County, according to the WQI Quality Scale, suggests a Good quality class, with a minor decline towards the south (79 to 77), a decline that is amplified in the Dolj County area until it empties into the Danube (67 to 63).
In this context, it is necessary to constantly monitor and evaluate water quality and maintain it at an optimal level in accordance with the provisions of the [5], especially as these rivers flow over the territory of three counties and are unloaded in the Danube.
Acknowledgments: None
Conflict of interest: None
Financial support: None
Ethics statement: None